


Severe weather events and associated flooding hazard
Key Finding
Since 2010, Queensland has been directly impacted by 8 severe tropical cyclones and more than 20 cyclones of other intensities. While state-wide trends must be treated with caution, in general, observations suggest there has been a rise in extreme severe weather events due to climate change and that tropical cyclones are travelling slower and southward, with increasing rainfall intensity giving rise to potentially extreme associated flooding.
Tropical cyclones (TC) and severe thunderstorms are long-standing features of Queensland’s climate.
Since 2010, Queensland has been directly impacted (those that have made landfall) by 8 severe tropical cyclones (STC), as well as more than 20 cyclones of other intensities.
Whereas the cyclone season officially runs from 1 November to 30 April, records since 1967 show a greater propensity for cyclones to impact Queensland from January through to April. Every TC is unique in its duration, size, intensity, movement and impact.
Severe thunderstorms can occur at any time of the year, although they are less common during Queensland’s ‘dry season’ (winter).
Extreme rainfall events, leading to potentially significant flooding events, are relatively common along Queensland’s north-eastern seaboard and in the Gulf, being areas which have greater exposure to rainfall associated with the northern Australian Monsoon, TCs and lows.
Although model projections show a future decrease in the number of TCs regionally, more intense cyclones (including those classified as STCs) are expected. Recent historical data analysis also suggests TCs are travelling slower and southward with increasing rainfall intensity giving rise to potentially extreme associated flooding.
It is assumed that occurrence rates of severe thunderstorms, and the intensity of heavy rainfall events, are likely to increase as a result of climate change as increases in mean temperature leads to an increase in surface warming thereby putting more moisture in to the air through evaporation.
More information:
Relevant Sustainable Development Goals’ targets
| Month | November | December | January | February | March | April | May |
|---|---|---|---|---|---|---|---|
| Number of Events | 2 | 17 | 43 | 33 | 34 | 16 | 1 |
| Percentage of Total Events | 1% | 12% | 29% | 23% | 23% | 11% | 1% |
| Date Range | Rain | Wind | Hail | Lightning | Tornado |
|---|---|---|---|---|---|
| 1917 - 1966 | 25 | 208 | 146 | 12 | 19 |
| 1967 - 2000 | 109 | 200 | 342 | 5 | 45 |
| 2001 - 2006 | 213 | 378 | 216 | 6 | 22 |
| 2007 - 2010 | 556 | 187 | 117 | 1 | 10 |
| 2011 - 2016 | 367 | 167 | 220 | 2 | 11 |
| Totals | 1270 | 1140 | 1041 | 26 | 107 |
The Number and Type of Severe Weather Events since 1917
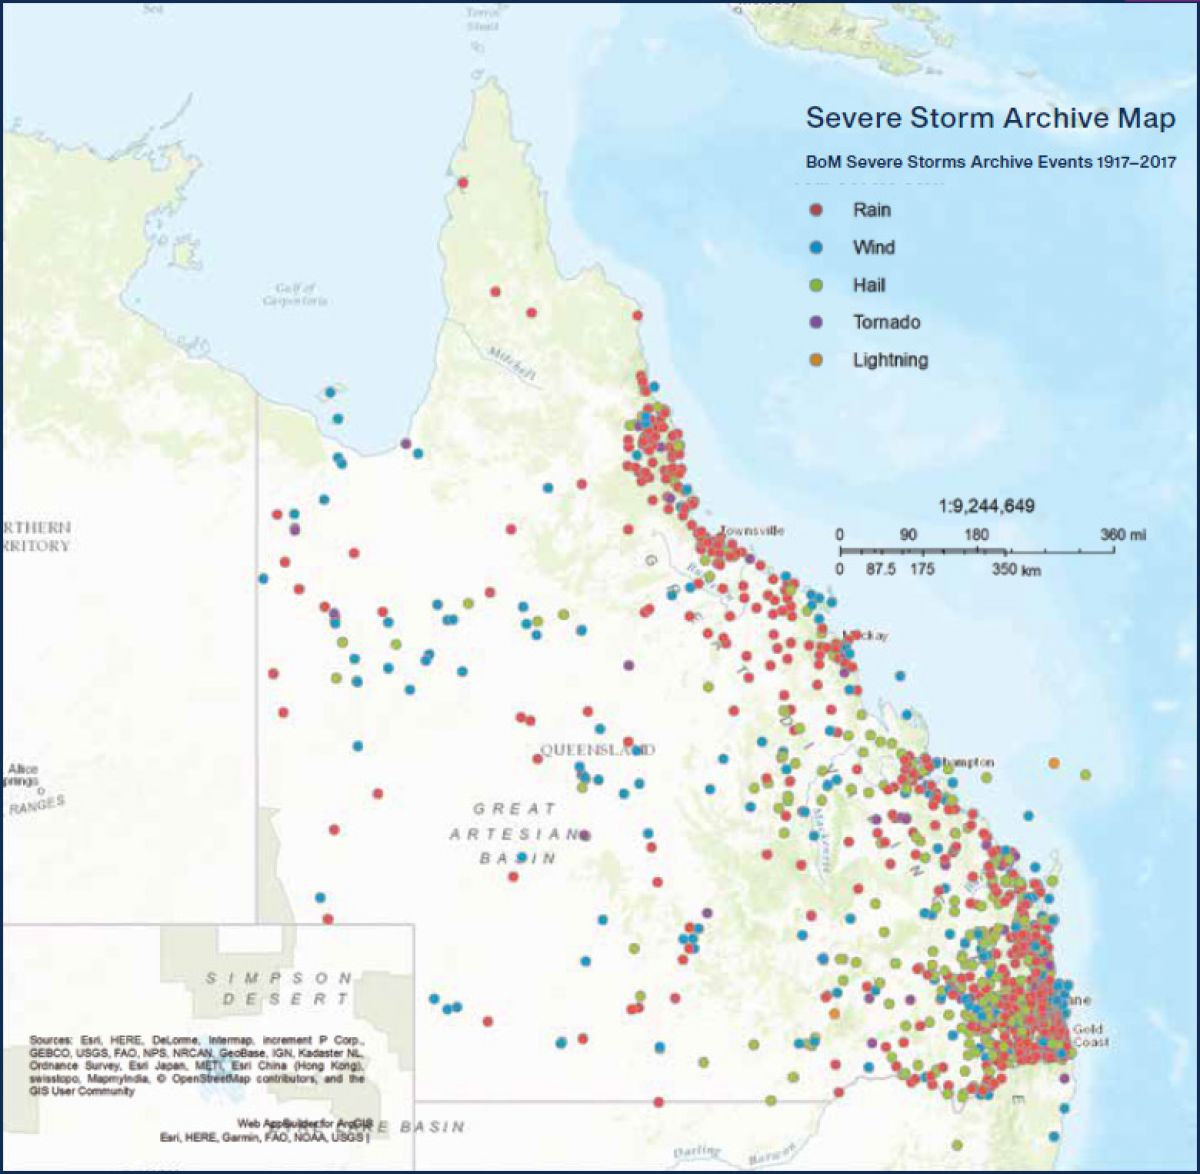
Source: Data from Bureau of Meteorology, map created by Queensland Fire and Emergency Services.