

Fire weather and associated bushfire hazard
Key Finding
Between 1950 to 2018, Queensland saw an overall pattern of increased severity in the fire-weather season due to climate change, with the exception of small pockets of the north and west.
Bushfires have had severe impacts in Queensland, encompassing loss of life (human, other animal, forest), ecological damage, and large economic costs.
Climate change is having an impact on the frequency and severity of dangerous fire-weather conditions. Analysis of the long-term changes in fire-weather conditions for Queensland between 1950 and 2018* confirm higher temperatures, less rain in most parts of the state and longer, earlier fire seasons.
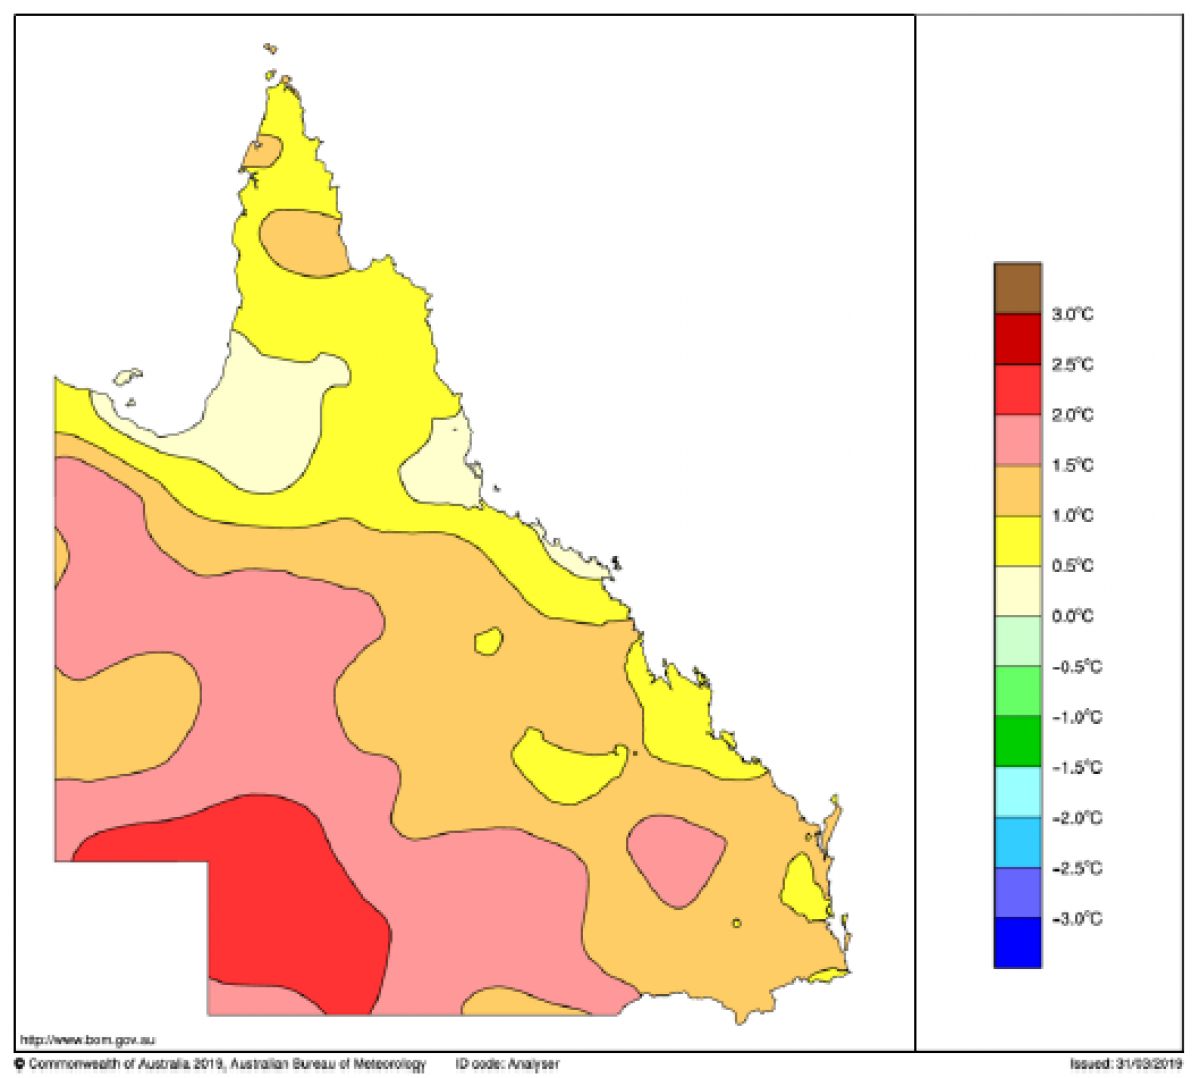
- Annually averaged maximum temperatures have risen for most of the state.
- While annual rainfall has risen over most of Queensland’s far-west and far-north, it has declined elsewhere, particularly on the east coast.
- Days with predicted ‘very high’ fire danger conditions are increasing across the state, particularly in the south.
- Fire seasons are starting earlier and, in some cases, finishing later.
- Changes have been more rapid in recent decades (1989–2018).
Climate change projections suggest that these observed trends are likely to continue.
Due to the diversity of Queensland’s climate regions, state-wide trends must be treated with caution when using them to describe the trends within any one climate region, e.g. for the State as whole the in-active period of the year for fire weather appears to be narrowing, but this is representative of the active period starting earlier in some regions and ending later in others.
*Based on assessment of the Forest Fire Danger Index (FFDI) and other relevant climate variables such as rainfall and temperature between 1950 and 2018.
More information:
Relevant Sustainable Development Goals’ targets
Total Linear Temperature Between 1950–2018
| Region | Maximum temperature | Mean rainfall | Rainfall | Highest FFDI |
|---|---|---|---|---|
| Queensland | +1.30 | 634 | -32 | +4 |
| South East Coast | +1.09 | 930 | -162 | +14 |
| Wide Bay and Burnett | +1.15 | 747 | -124 | +8 |
| Central Coast | +0.92 | 807 | -148 | +1 |
| North Coast | +0.53 | 1473 | -18 | -2 |
| Cape York Peninsula | +0.83 | 1298 | +89 | +5 |
| Central South | +1.56 | 489 | -77 | +14 |
| Central | +1.22 | 536 | -120 | +7 |
| North West | +1.01 | 712 | +38 | +1 |
| South West | +1.83 | 290 | +2 | -3 |