


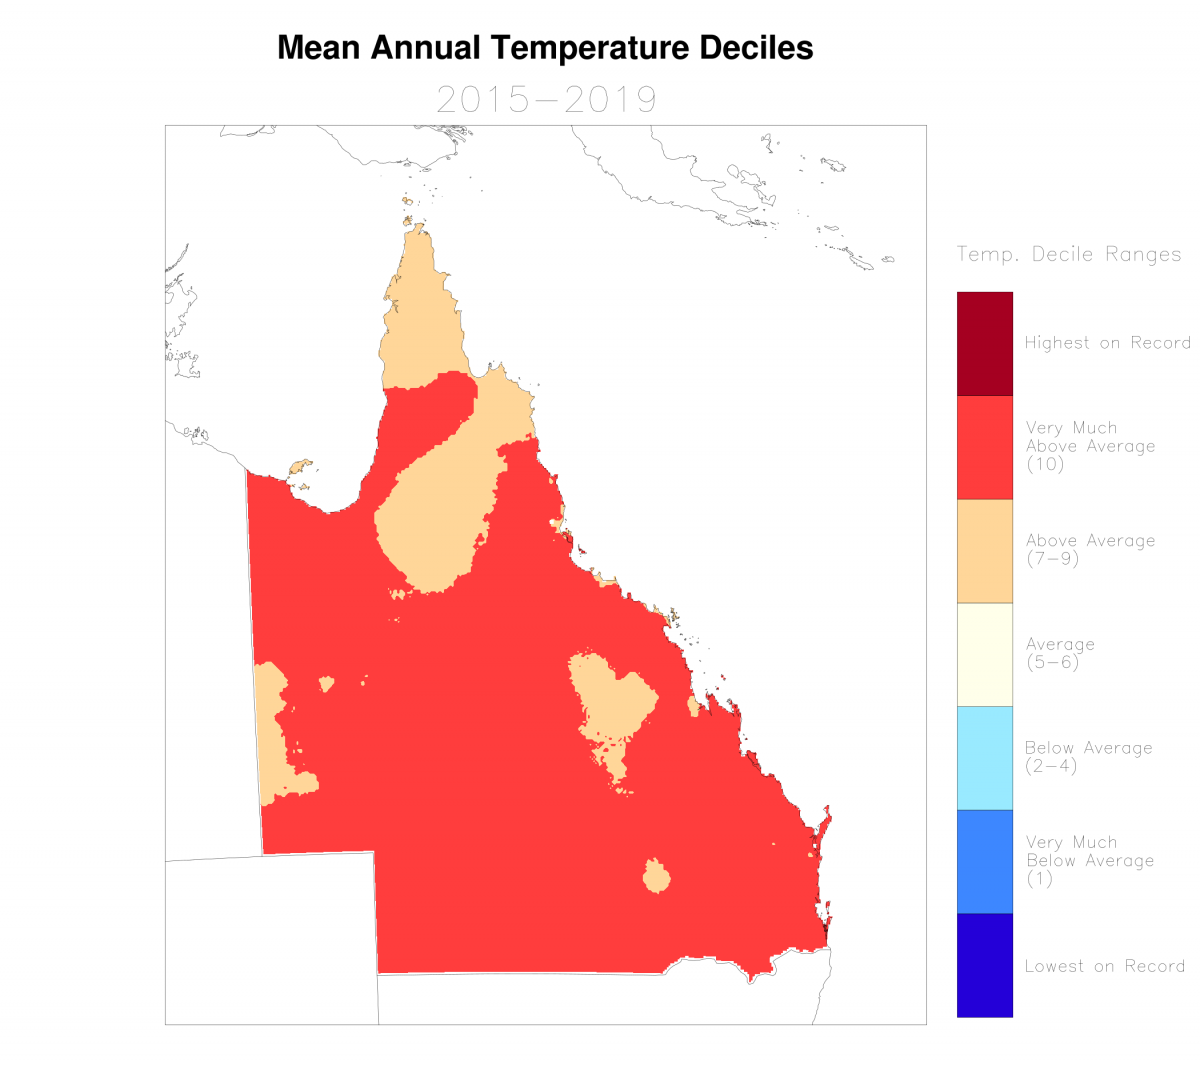
Mean annual temperature
Key Finding
2015 to 2019 was Queensland’s warmest 5-year period on record.
Filter this information
Queensland or temperature weather stations:
- Map
- List
Temperature weather stations (select locations to filter information)
Queensland
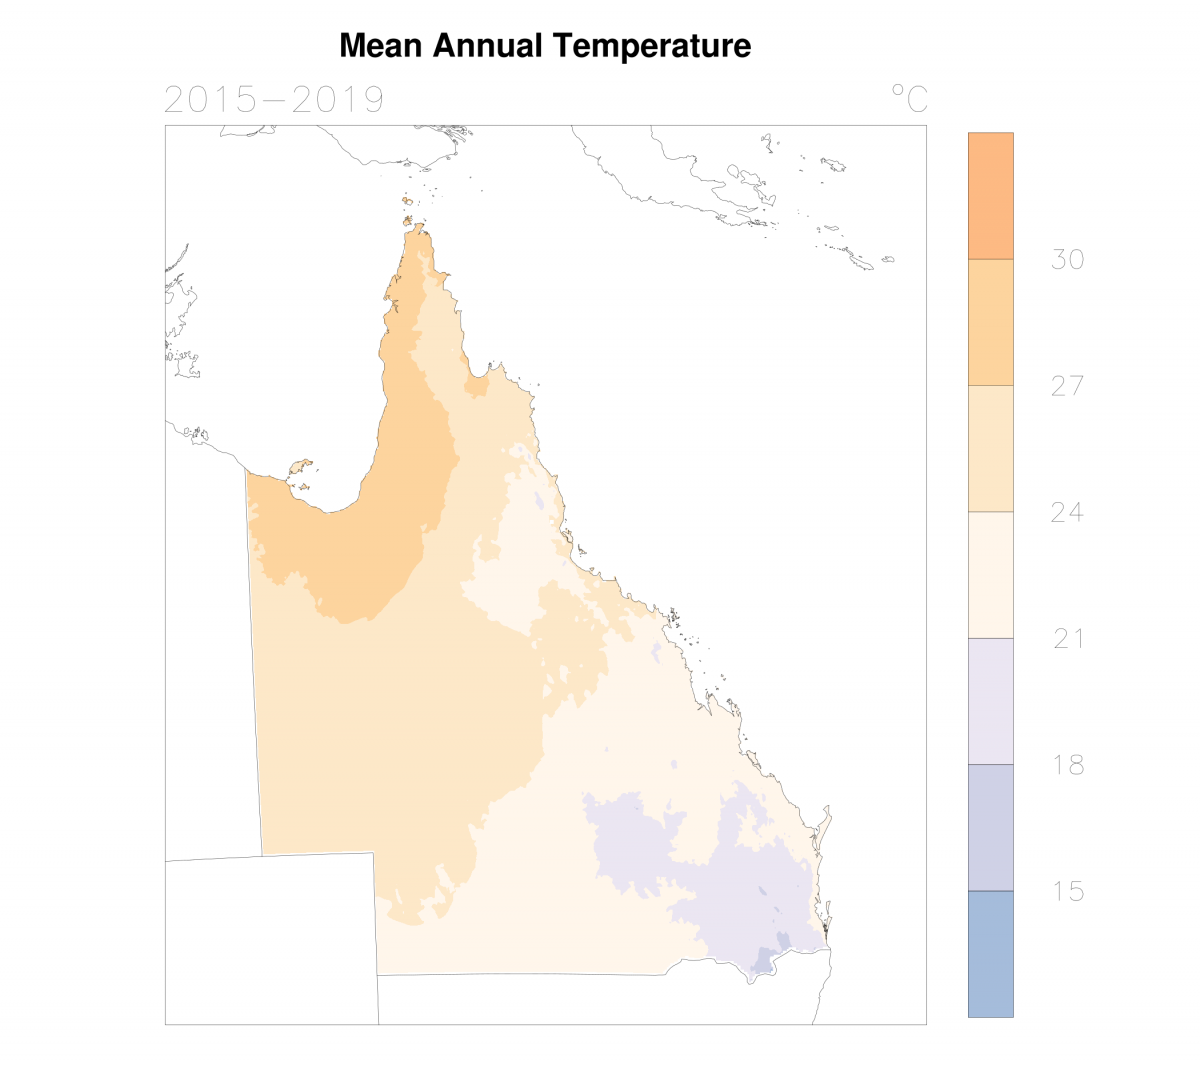
Averaged over the last 5-year (2015 to 2019) period, Queensland’s statewide mean annual temperature of 24.6°C was 1.4°C above the 1961–1990 average and the warmest since records began in 1910†.
Each year from 2015 to 2019 was amongst the 7 warmest on record.
- 2017 was Queensland’s warmest year on record, the state-wide mean annual temperature (24.8°C) being +1.6°C above the 1961 to 1990 average.
- 2018 (+1.4°C above average) and 2019 (+1.3°C above average) were the fifth and sixth warmest years on record.
Long-term variability and trends
While records indicate Queensland’s statewide mean annual temperature has warmed by around +1°C since 1910, most of this warming has occurred over the past 50 to 60 years.
Taking 1960 as a reference year, the statewide mean annual temperature has risen at an average rate of about +0.3°C per decade, with mean daily minimum temperatures warming at a slightly higher rate than mean daily maximum temperatures.
The strongest warming since 1960 has been observed in inland parts of the state.
†. The state-wide mean annual temperature is the average of the daily maximum and daily minimum.
The state-wide mean annual temperature (2015–2019) was calculated using mean annual temperatures for years 2015 through to 2019. The publicly available ACORN-SAT datasets did not include data up to the end of 2019 at the time of publication. The mean annual temperature for 2019 was obtained from the Bureau of Meteorology. The Bureau’s process for calculating spatial means is described here.
Birdsville Airport
The 1961 to 1990 mean annual temperature is 23.2°C.
2017 was the warmest year on record with a mean temperature of 25.2°C being +2.0°C above average.
Mean annual temperatures between 2011 and 2017 were consistently warmer than average.
Mean annual temperatures have warmed by about +2.0°C over the past 50-year period.
Insufficient data was available for 2019.
Boulia
The 1961 to 1990 mean annual temperature is 24.3°C.
The mean temperature in 2018 was 26.1°C (+1.8°C above average), the second warmest year on record.
Data for 2013 to 2017 was not available.
Cairns Airport
The 1961 to 1990 mean annual temperature is 24.8°C.
The mean temperature in 2016 was 26.1°C (+1.3°C above average), the warmest year on record.
Mean annual temperatures were warmer than average for each year over the 1998 to 2018 period.
Mean annual temperatures have warmed by about +1.0°C over the past 50-year period.
Insufficient data was available for 2019.
Charleville Airport
The 1961 to 1990 mean annual temperature is 20.4°C.
2017 was the warmest year on record with the mean temperature of 23.0°C being +2.6°C above average.
Mean annual temperatures between 2013 and 2017 were consistently warmer than average.
Mean annual temperatures have warmed by more than +1.0°C over the past 50-year period.
Insufficient data was available for 2019.
Gayndah Airport
The 1961 to 1990 mean annual temperature is 20.9°C.
2016 was the warmest on record with a mean temperature of 22.4°C being +1.5°C above average.
In 2005 and 2014, the mean temperature of 22.3°C was +1.4°C above average, and equal second warmest on record.
In 2017, the mean temperature of 22.2°C was +1.3°C above average and third warmest on record.
Mean annual temperatures were consistently warmer than average between 2012 and 2017.
Mean annual temperatures have warmed by about +1.0°C over the past 50-year period.
Insufficient data was available for 2018 and 2019.
Longreach Airport
The 1961 to 1990 mean annual temperature is 22.9°C.
2017 was the warmest year on record with a mean temperature of 25.4°C being +2.5°C above average.
Mean annual temperatures were warmer than average for each year over the 2014 to 2017 period.
Insufficient data was available for 2018 and 2019.
Mackay
The 1961 to 1990 mean annual temperature is 22.2°C.
In 2017, the mean temperature of 23.7°C was +1.5°C above average and the second warmest on record.
2016 was the warmest on record with a mean temperature of 23.9°C (+1.7°C above average).
Mean annual temperatures were consistently warmer than average over the 2001 to 2017 period.
Mean annual temperatures have warmed by more than +1.0°C over the past 50-year period.
Insufficient data was available for 2018 and 2019.
More information:
- Australian Climate Observations Reference Network surface air temperature dataset
- Bureau of Meteorology temperature trends
Relevant Sustainable Development Goals’ targets
Download data from Queensland Government data
Metadata
Spatial maps of air temperature and related quantities were calculated from gridded Australian Water Availability Project (AWAP) data. Mean annual temperatures at selected weather stations were calculated from Australian Bureau of Meteorology Australian Climate Observations Reference Network – Surface Air Temperature (ACORN–SAT) datasets.
All datasets were current as at February 2020. Subsequent updates to data may result in minor changes to some values. The ACORN–SAT datasets contained data up to May 2019 at most locations.
For each location, mean annual temperatures (where available) are plotted for the extent of the ACORN–SAT dataset records. Rolling 10-year averages are plotted only if there are 10 consecutive years of annual data. The Bureau of Meteorology currently calculate temperature anomalies based on the 1961 to 1990 period.
Data source: Bureau of Meteorology, Australian Water Availability Project gridded monthly data.
Plotted by the Queensland Government Department of Environment and Science. Decile base-period 1910 to 2019.
Data source: Bureau of Meteorology, Australian Water Availability Project gridded monthly data.
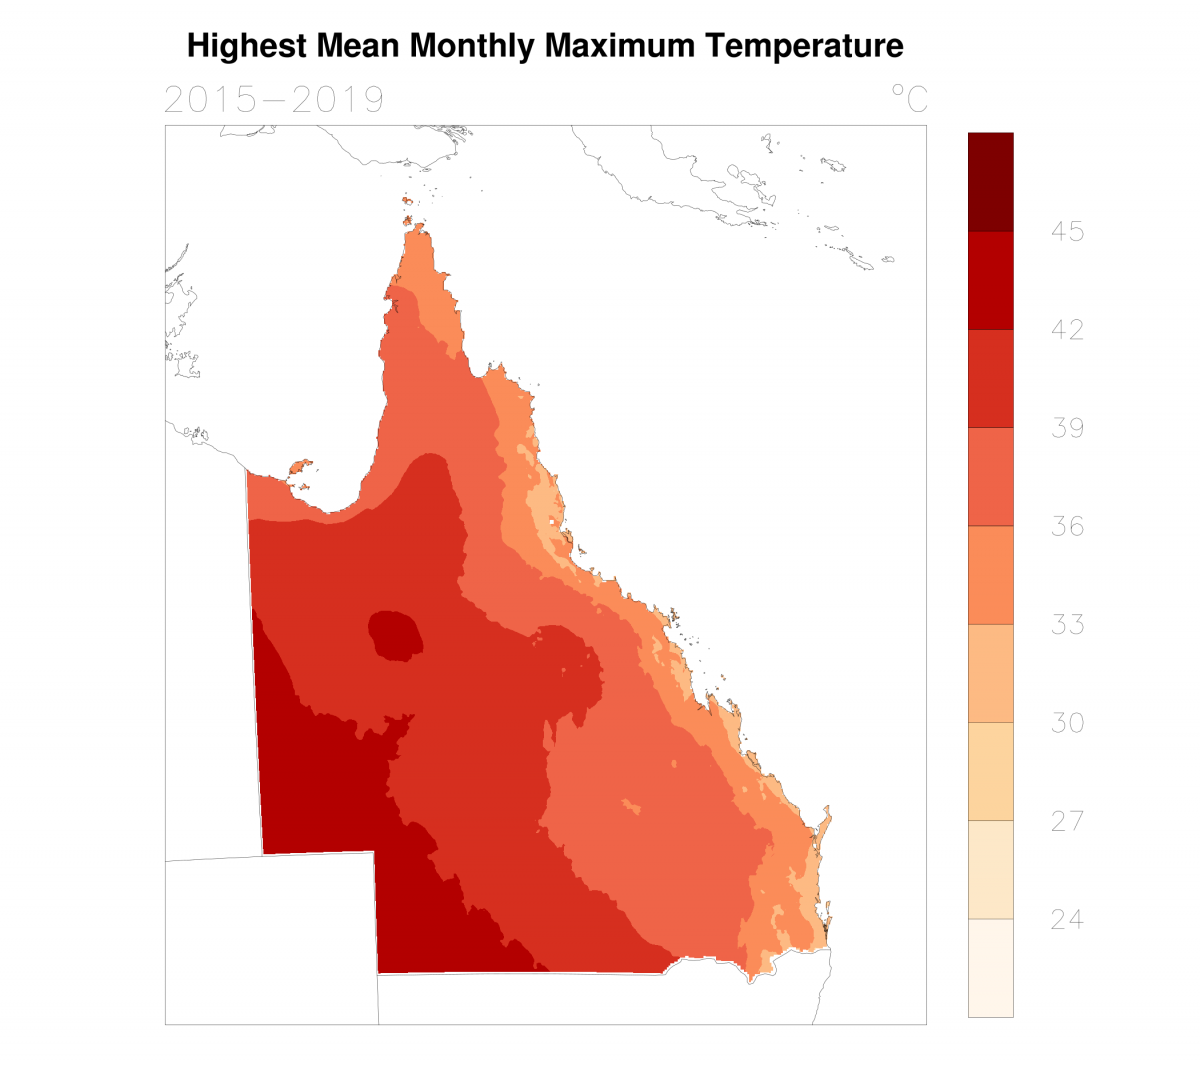
Plotted by the Queensland Government Department of Environment and Science.
Data source: Bureau of Meteorology, Australian Water Availability Project gridded monthly data.
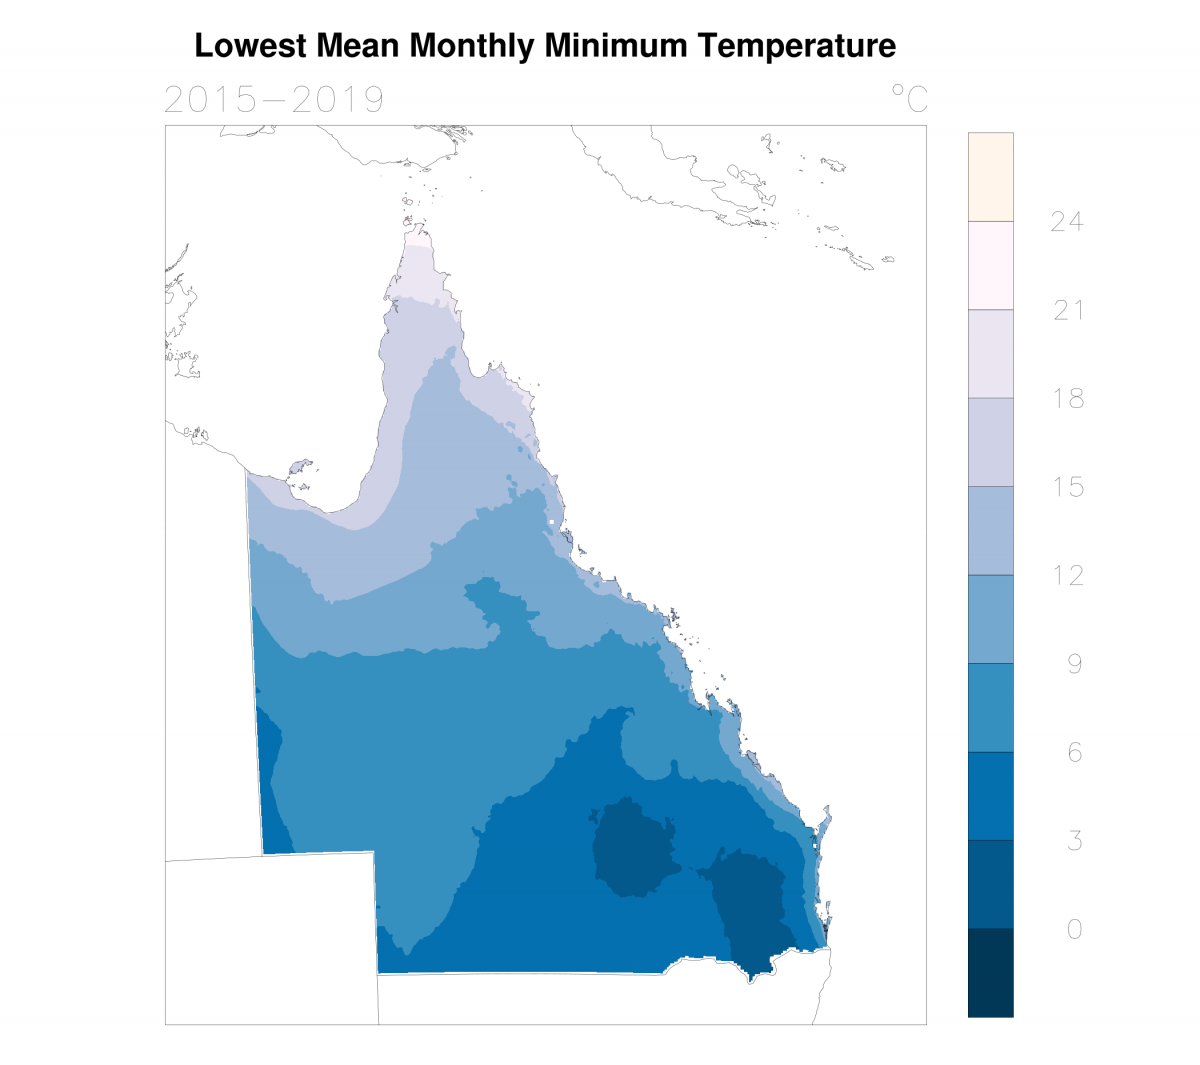
Plotted by the Queensland Government Department of Environment and Science.
Data source: Bureau of Meteorology, Australian Water Availability Project gridded monthly data.
Plotted by the Queensland Government Department of Environment and Science.