


Annual rainfall
Key Finding
Drier than normal conditions prevailed across large parts of Queensland over the period from 2013 to 2019, with many areas experiencing drought.
Filter this information
Queensland or rainfall weather stations:
- Map
- List
- Augathella Post Office
- Barcaldine Post Office
- Birdsville Police Station
- Brian Pastures
- Burketown
- Cairns Airport
- Camooweal Township
- Cunnamulla Post Office
- Fairymead Sugar Mill
- Kalamia Estate
- Palmerville
- Pittsworth, Yandilla St.
- Pleystowe Sugar Mill
- Townsville Airport
- University of Queensland, Gatton
- Westland
Rainfall weather stations (select locations to filter information)
Queensland
Drier than normal conditions prevailed in many inland and southern parts of Queensland over the period 2013 to 2019.
In 2016, rainfall was above average in western Queensland and below average in some northern and southeastern areas.
- The El Niño-Southern Oscillation (ENSO) was in a neutral phase over much of the 2013 to 2019 period.
- An El Niño prevailed for most of 2015, and near-El Niño conditions occurred in the second half of 2019.
Although the long-term (1900 to 2015) statewide average annual rainfall for Queensland is 616mm, this is highly variable on an annual and a decadal basis.
- For example, Queensland’s statewide annual rainfall averaged over the 5-year 2015 to 2019 period (544mm) was the lowest for a 5-year period since 2002 to 2006 (519mm).
From mid-2015 to early 2017, more than 80% of the state was drought declared under state government processes, and more than 65% of the state remained drought declared at the end of 2019.
In contrast to these drier than average conditions, Queensland’s statewide annual rainfall was above average each year from 2007 to 2012.
- 2010 was Queensland’s wettest year on record (1,137mm).
Palmerville
The long-term 1900 to 2015 average annual rainfall is 1,033mm.
Recent (2014 to 2019) annual rainfall has been below the long-term average.
Burketown
The long-term 1900 to 2015 average annual rainfall is 786mm.
Rainfall was below the long-term average in 2015 and 2016, and above the long-term average in 2017 and 2018.
In 2019, the total annual rainfall (361mm) was less than half the long-term average.
Cairns Airport
The long-term 1910 to 2015 average annual rainfall is 2,009mm.
Annual rainfall was below the long-term average each year from 2013 to 2017.
Annual rainfall was near-average in 2019.
Insufficient data was available for 2018.
Townsville Airport
The long-term 1900 to 2015 average annual rainfall is 1,173mm.
Rainfall between 2013 and 2018 was below the long-term average. Rainfall for 2015 (398mm) was the lowest since 187mm was recorded in 1902.
Kalamia Estate
The long-term 1900 to 2015 average annual rainfall is 1,019mm.
Recent (2014 to 2019) annual rainfall has been below the long-term average.
Pleystowe Sugar Mill
The long-term 1900 to 2015 average annual rainfall is 1,645mm.
Annual rainfall for 2015 (951mm) was the lowest since 2004 when 882mm was recorded.
Westland
The long-term 1900 to 2005 average annual rainfall is 380mm.
Insufficient data was available for 2006 to 2019.
Camooweal
The long-term 1900 to 2015 average annual rainfall is 400mm.
Annual rainfall for 2016 (668mm) was the highest since 2011. However, rainfall was below average each year from 2017 to 2019.
Birdsville Police Station
The long-term 1900 to 2005 average annual rainfall is 170mm.
Insufficient data was available for most of the years 2006 to 2019.
Fairymead Sugar Mill
The long-term 1900 to 2013 average annual rainfall is 1,065mm.
Rainfall for 2019 (341mm) was the lowest since records commenced in 1881.
Annual rainfall of 1,734mm in 2013 was the sixth highest on record.
Insufficient data was available for the years 2014 to 2019.
University of Queensland, Gatton
The long-term 1900 to 2015 average annual rainfall is 773mm.
Rainfall was below the long-term average in 2018 and 2019; the total for 2019 (230 mm) was the lowest since records commenced in 1899.
Brian Pastures
The long-term 1900 to 2012 average annual rainfall is 721mm.
Insufficient data was available for the years 2013 to 2019.
Pittsworth, Yandilla St.
The long-term 1900 to 2015 average annual rainfall is 693mm.
Rainfall for 2019 (172mm) was the lowest since records commenced in 1887.
Augathella
The long-term 1900 to 2015 average annual rainfall is 527mm.
Annual rainfall for 2015 (285mm) was well below the long-term average.
Rainfall for 2016 (658mm) was above long-term average.
Insufficient data was available for 2017 to 2019.
Cunnamulla Post Office
The long-term 1900 to 2015 average annual rainfall is 369mm.
Rainfall was below the long-term average in 6 of the last 7 years (2013, 2014, 2015, 2017, 2018 and 2019).
More information:
Relevant Sustainable Development Goals’ targets
Download data from Queensland Government data
Metadata
Annual rainfall information has been compiled based on data sourced from the Bureau of Meteorology (BoM) High-Quality Australian Monthly Rainfall Dataset, current as at 17 February 2020. Subsequent updates to data may result in minor changes to some values.
For each location, annual rainfall totals are plotted against High-Quality Dataset records. Rolling 10-year averages are plotted only if there are 10 consecutive years of annual data. At some locations there were insufficient data to present information for recent years.
 Average annual rainfall, 2015 to 2019
Data source: Bureau of Meteorology, Australian Water Availability Project gridded monthly data. Plotted by the Queensland Government Department of Environment and Science.
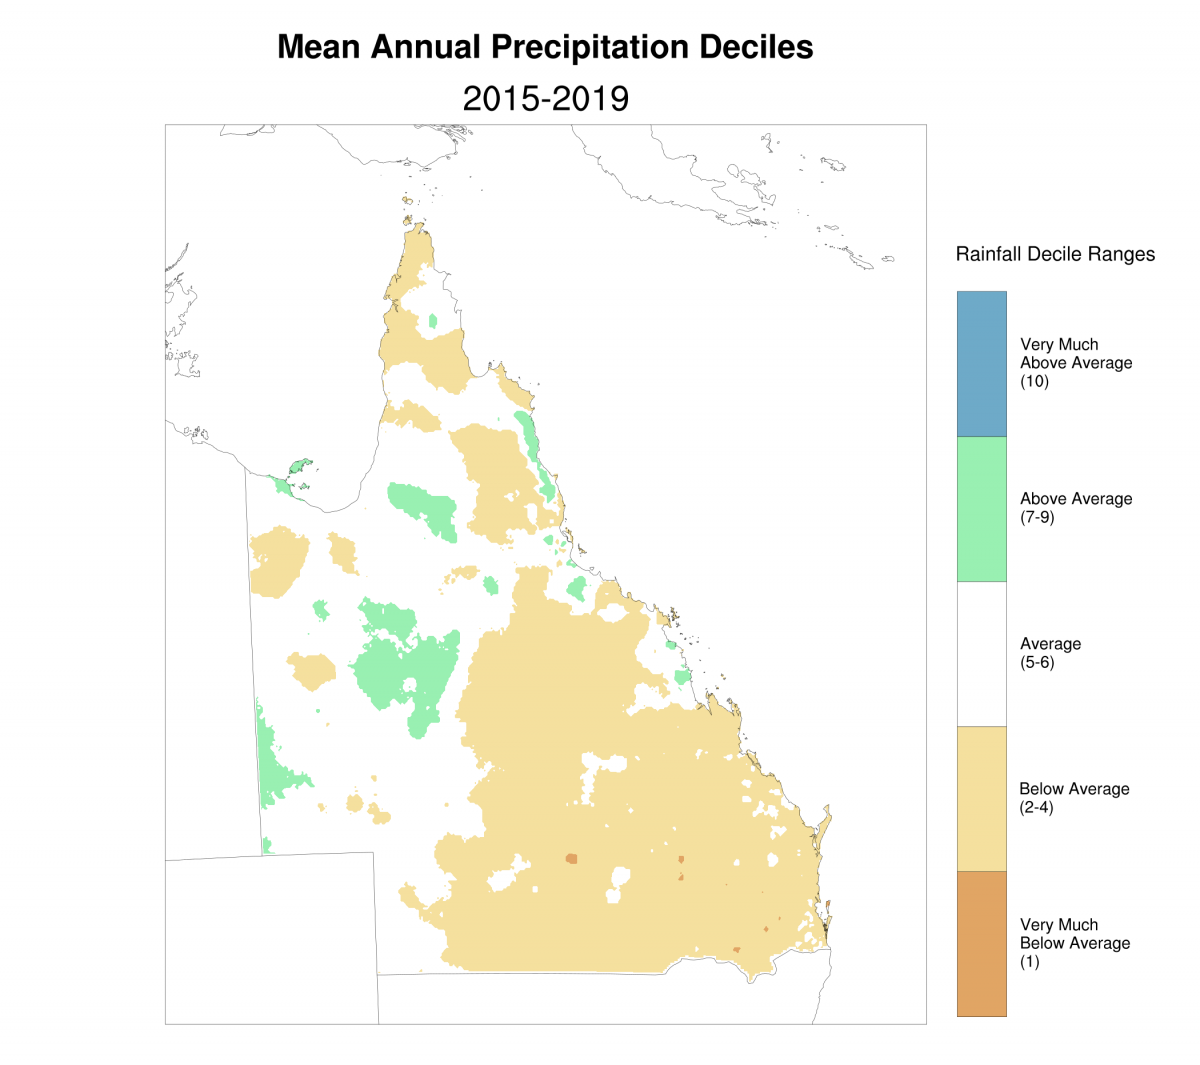 Rainfall percentile, January 2015 to December 2019
Plotted by the Queensland Government Department of Environment and Science, using gridded data sourced from the SILO historical climate database. The gridded data were interpolated from Bureau of Meteorology point observations. Percentile base-period 1890-2019.