Multi-year rainfall and pasture growth periods in Queensland
Key Finding
Queensland has endured dry conditions for 8 years (April 2012 – March 2020). Rainfall for this dry period was 37% below the previous (wet) period that lasted for 5 years (April 2007 – March 2012).
Queensland grazing lands have endured ongoing dry conditions for 8 years (April 2012 – March 2020), entering into a ninth successive year.
67% of the state was drought declared (as at June 2020).
Rainfall for the current 8-year dry period (April 2012 – March 2020) was 37% below the previous (wet) period that lasted for 5 years (April 2007 – March 2012).
The current dry period began in the April 2012–March 2013 period, with low surface water and inadequate water for stock, followed by deficiency in pasture biomass. Above average winter rainfall and unseasonal pasture growth in 2016 provided some respite.
Late season rainfall in March 2018 in the Gulf and far north Queensland regions produced beneficial pastures.
Extreme monsoonal rainfall and associated flooding early in 2019 severely impacted areas of north west Queensland, and resulted in the catastrophic mass deaths of domestic and native animals from the cold, wet and windy conditions.
Bushfires in 2018 and 2019 in coastal and hinterland areas burnt extensive areas of pasture, destroying the last remaining feed for some grazing enterprises.
The initial dry year (2012–13) was classified as a neutral El Niño Southern Oscillation (ENSO) year (neither El Niño nor La Niña): there have been 4 neutral years, 3 El Niño years and a La Niña. The La Niña year (2017–18) manifested as a dry year (against its classification) as were 3 of the neutral years.
More information:
- Animation explaining percentiles
- Drought declarations
- Drought Map Sequence Viewer
- Rainfall and Pasture Growth Map App
- Rainfall and pasture growth maps
- The Long Paddock — Australia’s Variable Rainfall
- Annual rainfall and pasture declaring in Queensland
- Extent of drought declarations in Queensland
Relevant Sustainable Development Goals’ targets
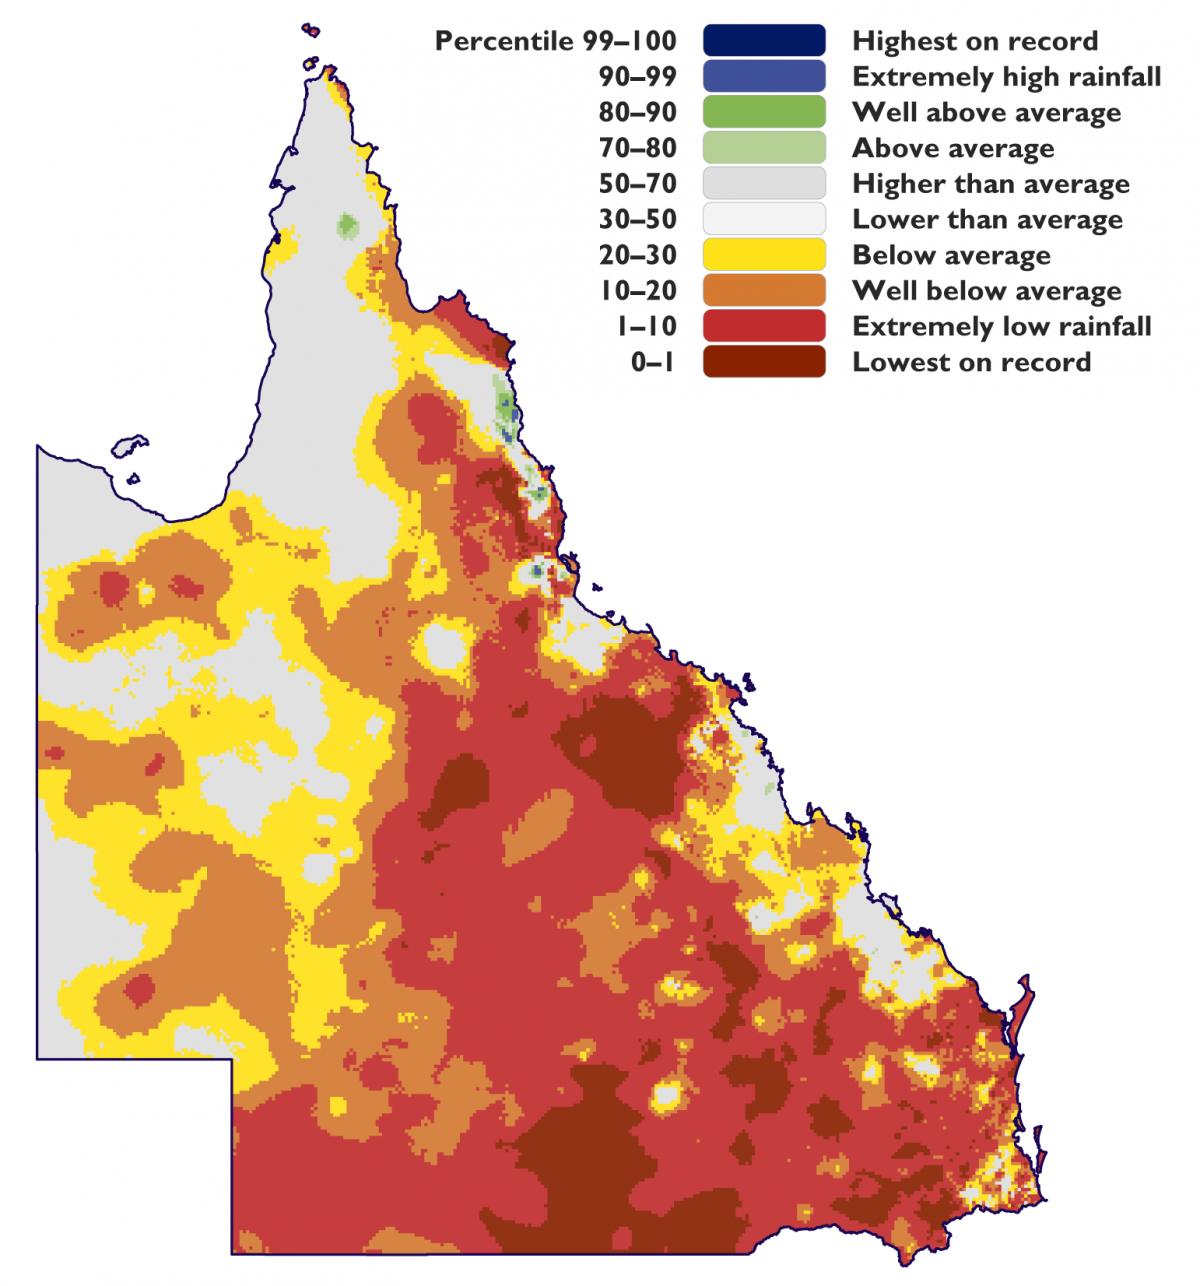
Queensland rainfall percentile from April 2012 to March 2020 (relative to historical records).
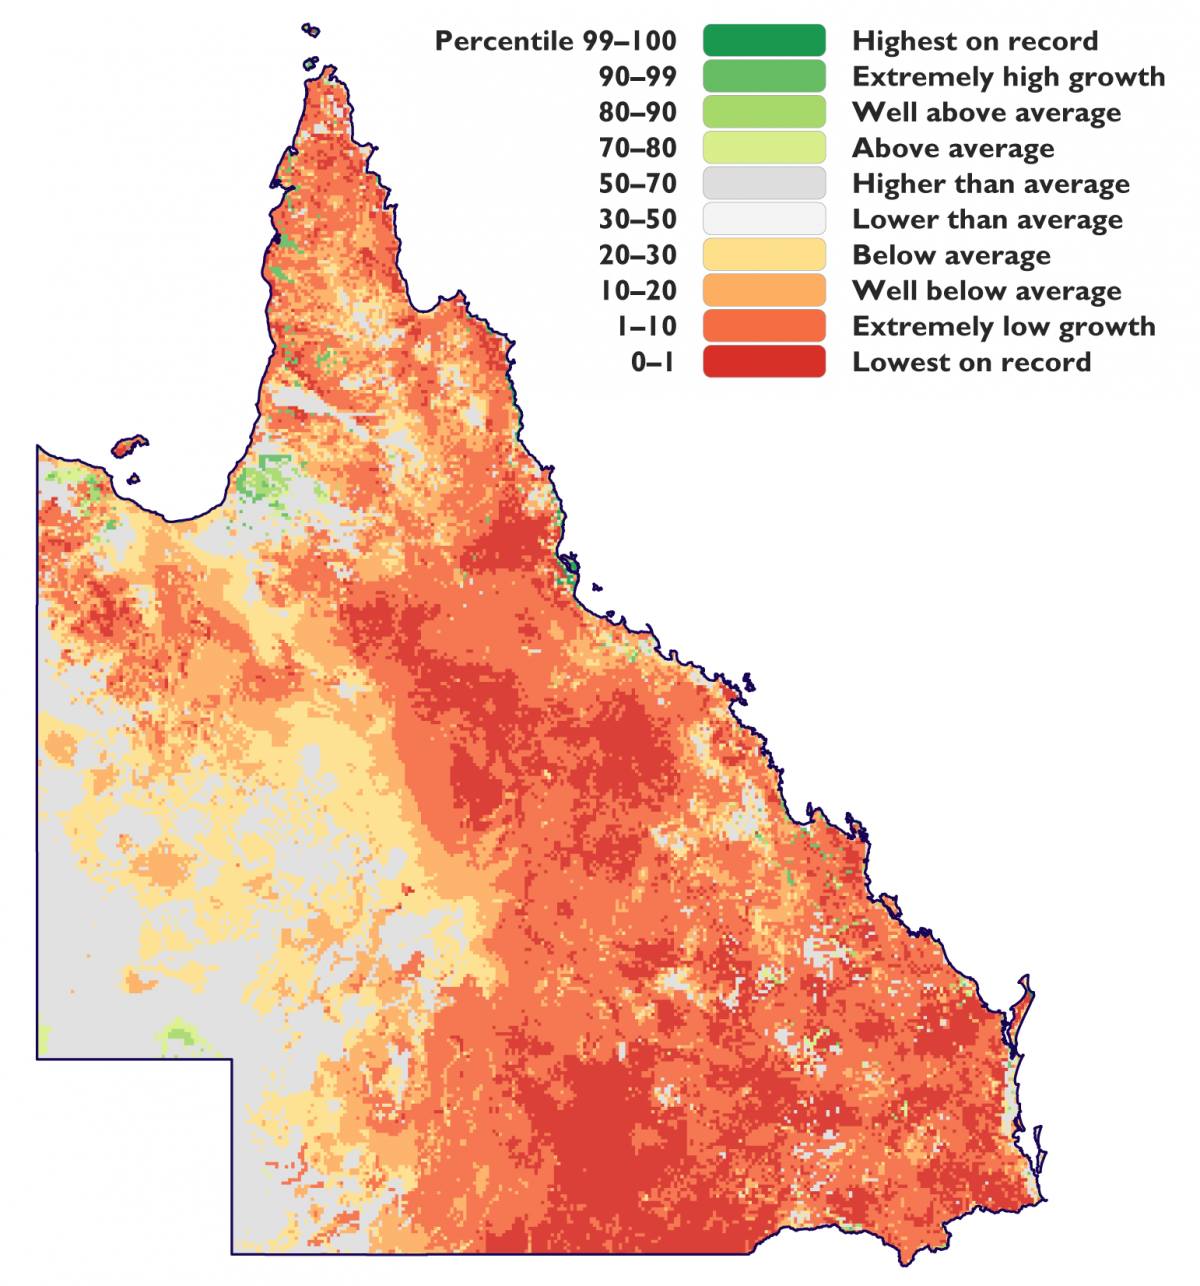
Queensland pasture growth percentile from April 2012 to March 2020 (relative to historical records).