Annual rainfall and pasture growth relative to historical records
Key Finding
Queensland grazing lands continued into the ninth successive dry year, with 67% of the state drought-declared. Widespread rainfall and pasture growth respite began in mid-January 2020. However, destructive flooding, catastrophic fires, a short wet season and insect plagues disrupted grazing enterprises’ attempts at herd rebuilding.
Large parts of Queensland have been in the lowest 30% of all years for rainfall and pasture growth, particularly in 2017–18 and 2018–19. 67% of the state was drought declared (as at June 2020).
Major flooding affected the Gulf and northern regions in March 2018 and again in February and March 2019. The 2019 floods (particularly) caused massive devastation of livestock and landscape, but both events resulted in some beneficial pasture growth, particularly in flood-out areas in the Channel Country region (far-west and south-west Queensland).
In 2019–20, areas across the central, north and north-west of Queensland faced a poor outlook, due to:
- lack of rainfall
- limited pasture growth response
- plague locusts decimating pastures (e.g. central and central-west Queensland region).
Central and far-west Queensland (including the Channel Country) benefited from the floods in the north and moderate rainfall each year, as well as above-average rainfall in early 2020.
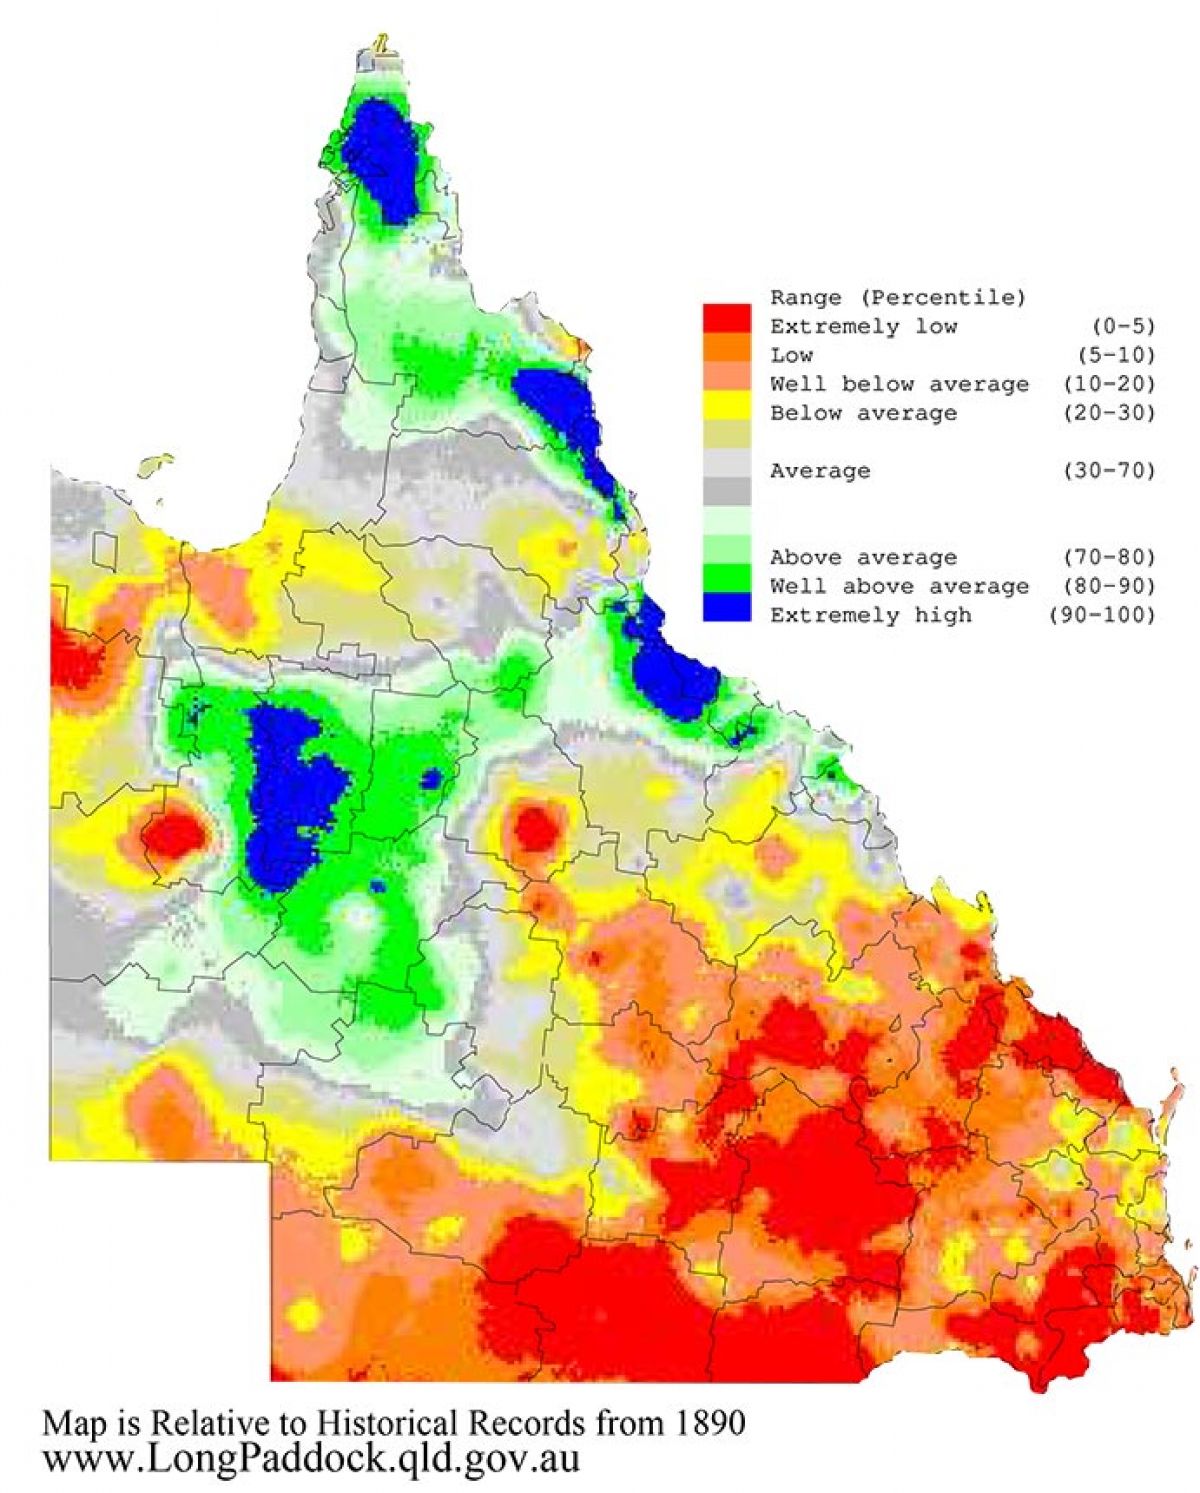
Eastern regions had average to above-average rainfall and pasture growth for the 2017–18 year; this deteriorated into the 2018–19 and 2019–20 periods.
Bushfires have been a common feature along the eastern coast for the last 2 years, particularly from September 2019 to early 2020.
Rainfall from late January to February 2020 provided some respite along the south-east coast, with pasture growth continuing into March.
More information:
- Animation explaining percentiles
- The Long Paddock — Australia’s variable rainfall
- Drought declarations
- Drought Map Sequence Viewer
- Extent of drought declarations in Queensland
- Multi-year rainfall and pasture growth periods in Queensland
Relevant Sustainable Development Goals’ targets
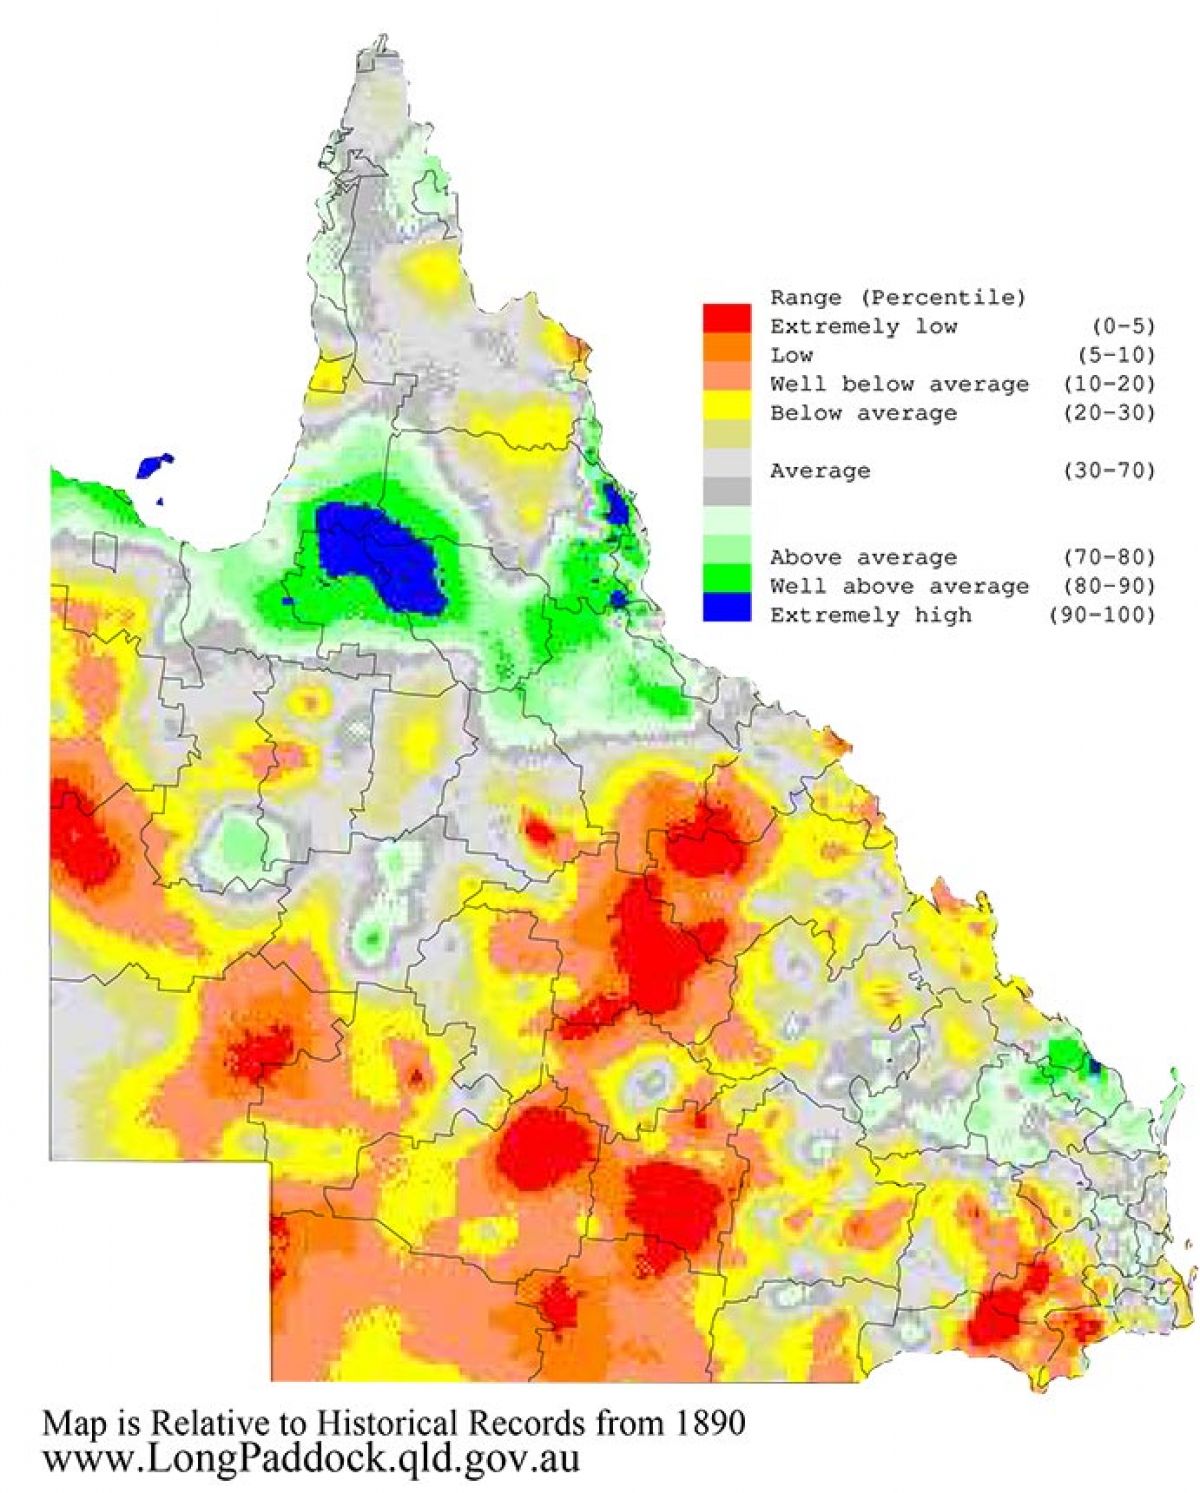
Queensland rainfall percentile from April 2017 to March 2018 (relative to historical records)
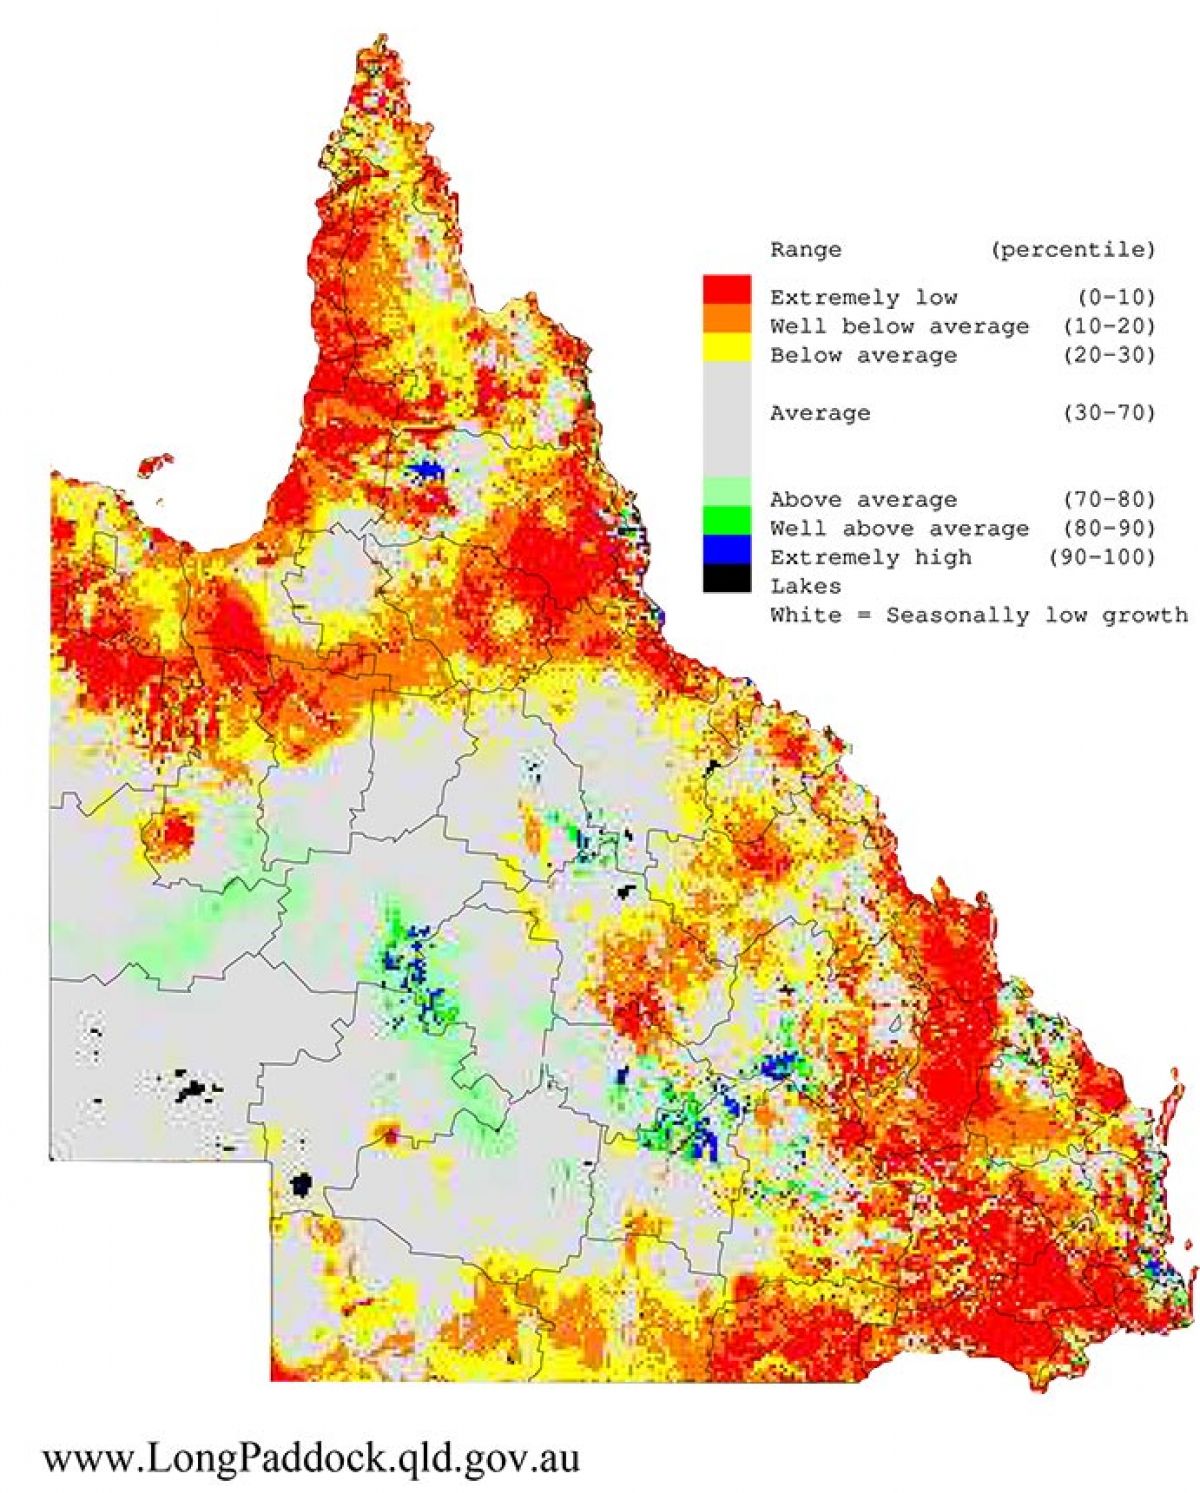
Queensland pasture growth percentile from April 2017 to March 2018 (relative to historical records)

Queensland rainfall percentile from April 2018 to March 2019 (relative to historical records)
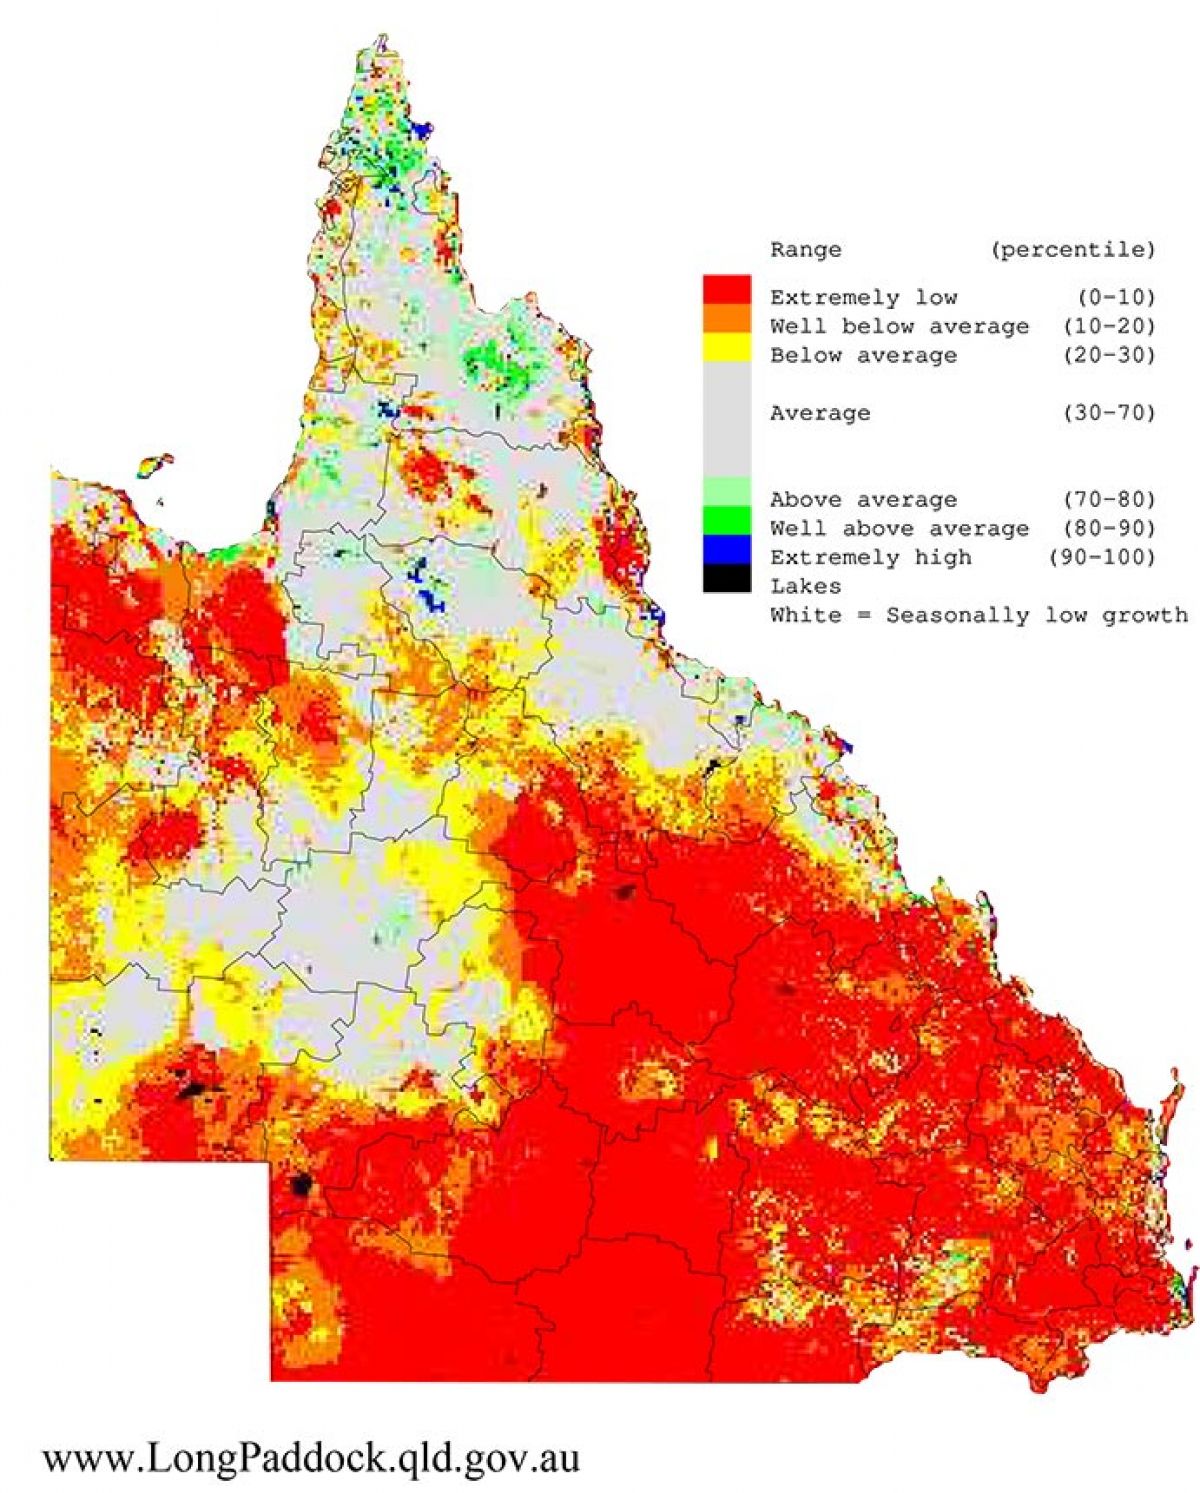
Queensland pasture growth percentile from April 2018 to March 2019 (relative to historical records)
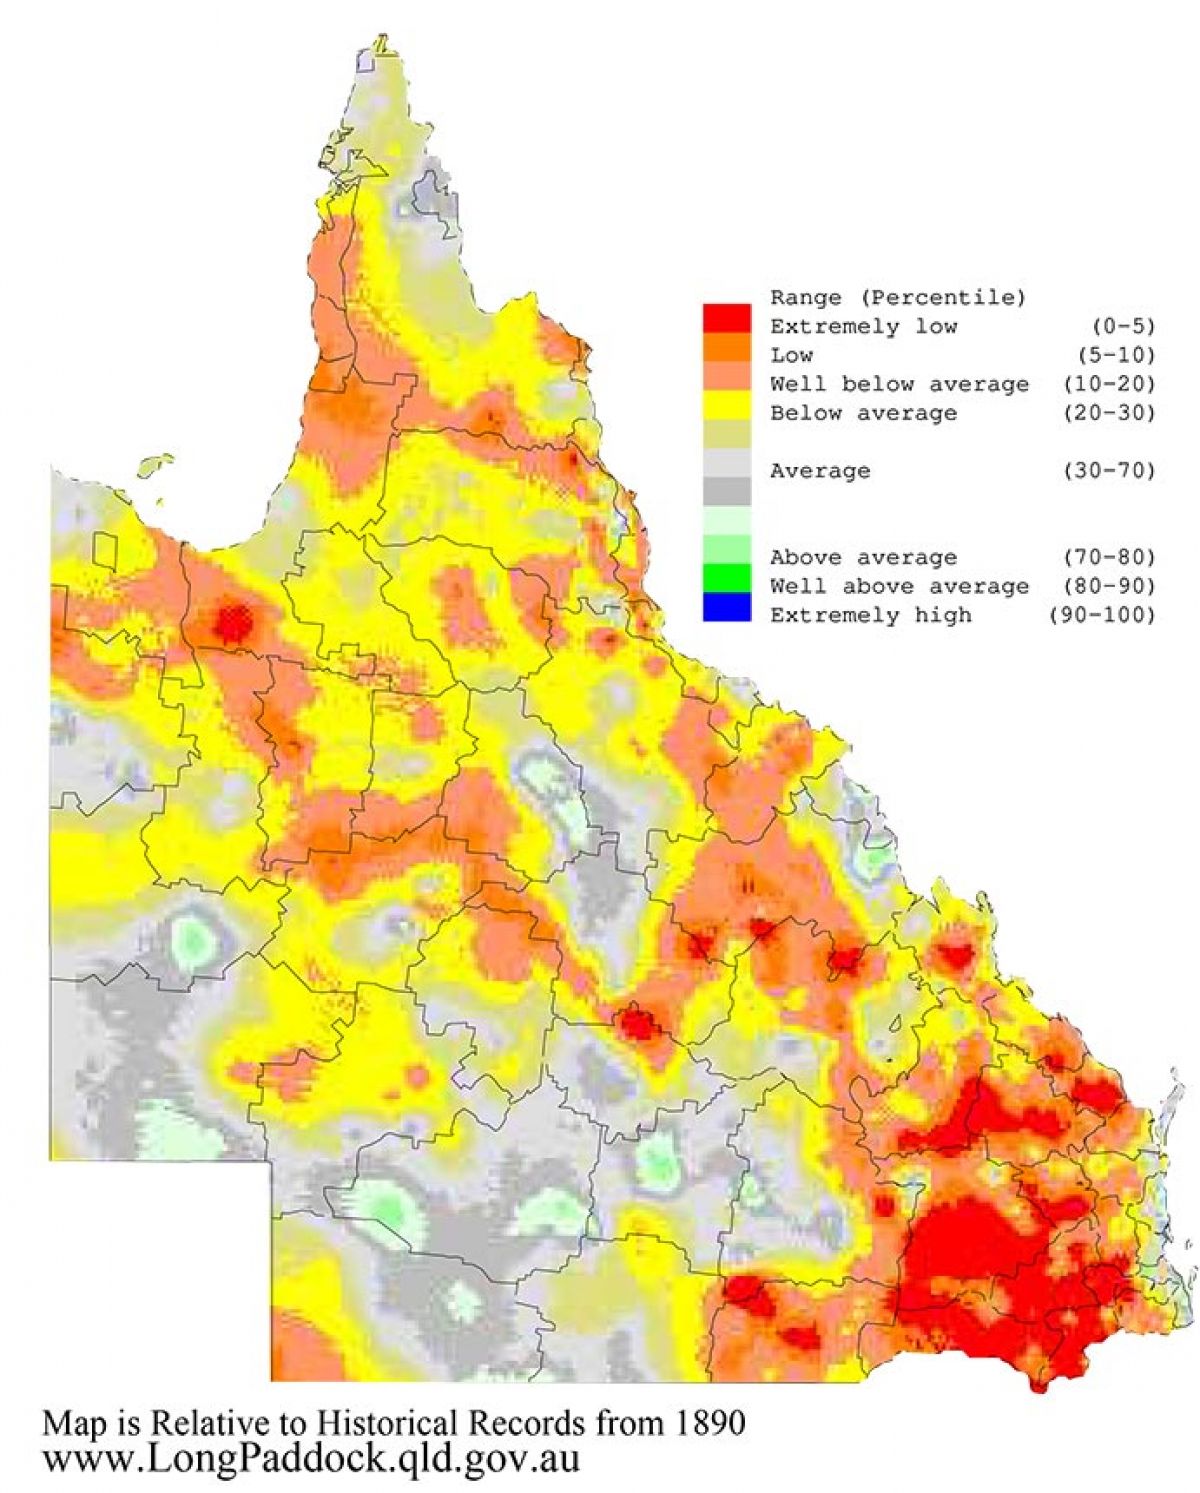
Queensland rainfall percentile from April 2019 to March 2020 (relative to historical records)
Queensland pasture growth percentile from April 2019 to March 2020 (relative to historical records)