Mean annual temperature
You are viewing an archived copy of the 2017 report.
Key finding
2017 was Queensland’s warmest year on record. The years 2013 through to 2016 were also amongst the warmest on record.
Filter this information
Queensland or temperature weather stations:
Temperature weather stations (select locations to filter information)
Queensland
2017 was Queensland’s warmest year on record.
The state-wide mean annual temperature is the average of the daily maximum and daily minimum. Queensland’s records date back to 1910.
The state-wide mean annual temperature in 2017 of 24.6°C was +1.4°C above the 1961 to 1990 average (23.2°C).
The previous warmest year on record was in 2005 (+1.3°C above average).
2017’s record warmth for Queensland was largely due to increased mean daily maximum temperatures, which were +1.6°C above the 1961 to 1990 average and wamest on record. In 2017, the state-wide mean daily minimum temperature was +1.2°C above average—the 5th warmest on record.
2017 followed 4 consistently much-warmer-than-average years: 2013 was 3rd warmest on record; 2016 ranked 4th.
Long-term variability and trends
While records indicate Queensland’s state-wide mean annual temperature has warmed by about +1°C since 1910, most of this warming has occurred over the past 50 to 60 years. Taking 1960 as a reference date, the state-wide mean annual temperature has risen by +1.1°C, with mean daily minimum temperatures warming at a slightly higher rate (+1.2°C) than mean daily maximum tempertatures (+1.0°C). The strongest warming since 1960 has been observed across Queensland’s southern half.
Birdsville Airport
The 1961 to 1990 mean annual temperature is 23.2°C.
2017 was the warmest year on record with a mean temperature of 25.1°C being +1.9°C above average. Mean annual temperatures were consistently warmer than average between 2012 and 2017.
Mean annual temperatures have warmed by about +1.5°C over the last 50-year period.
Boulia
The 1961 to 1990 mean annual temperature is 24.6°C.
Recent data (i.e. for 2012 to 2017) is not available.
Cairns Airport
The 1961 to 1990 mean annual temperature is 24.6°C.
The mean temperature in 2016 was 26.1°C (+1.5°C above average). This was the warmest on record.
Mean annual temperatures were warmer than average for each year over the 1998 to 2017 period.
Mean annual temperatures have warmed by about +1.0°C over the last 50-year period.
Charleville Airport
The 1961 to 1990 mean annual temperature is 20.7°C.
2017 was the warmest year on record with the mean temperature of 22.9°C being 2.2°C above average. Mean annual temperatures were consistently warmer than average between 2013 and 2017.
Mean annual temperatures have warmed by about +1.2°C over the last 50-year period.
Gayndah Airport
The 1961 to 1990 mean annual temperature is 20.8°C.
2016 was the warmest on record with a mean temperature of 22.4°C being +1.6°C above average.
In 2017, the mean temperature of 22.2°C was +1.4°C above average.
Mean annual temperatures were consistently warmer than average between 2012 and 2017.
Mean annual temperatures have warmed by about +1.0°C over the last 50-year period.
Longreach Airport
The 1961 to 1990 mean annual temperature is 23.7°C.
2017 was the warmest year on record with a mean temperature of 25.4°C being +1.6°C above average.
Mean annual temperatures were warmer than average for each year over the 2014 to 2017 period.
Mean annual temperatures have warmed by about +0.6°C over the last 50-year period.
Mackay
The 1961 to 1990 mean annual temperature is 22.5°C.
In 2017, the mean temperature of 23.6°C was +1.1°C above average and 3rd warmest on record.
2016 was the warmest on record with a mean temperature of 24.0°C (+1.5°C above average). Mean annual temperatures were consistently warmer than average over the 2001 to 2017 period.
Mean annual temperatures have warmed by about +1.0°C over the last 50-year period.
Indicator: Mean annual temperature
The following mean annual air temperature information for selected locations has been compiled based on data sourced from the Bureau of Meteorology (BoM) Australian Climate Observations Reference Network – Surface Air Temperature (ACORN-SAT) dataset (to 2017), as at February 2018. Subsequent updates to data may result in minor changes to some values. For each location, mean annual temperatures (where available) are plotted for the extent of the ACORN-SAT dataset records. Rolling 10-year averages are plotted only if there are 10 consecutive years of annual data. The Bureau of Meteorology currently calculate temperature anomalies based on the 1961 to 1990 period. Queensland’s State-wide mean annual temperature for the 1981 to 2010 period is approximately +0.4°C warmer than the 1961 to 1990 average.
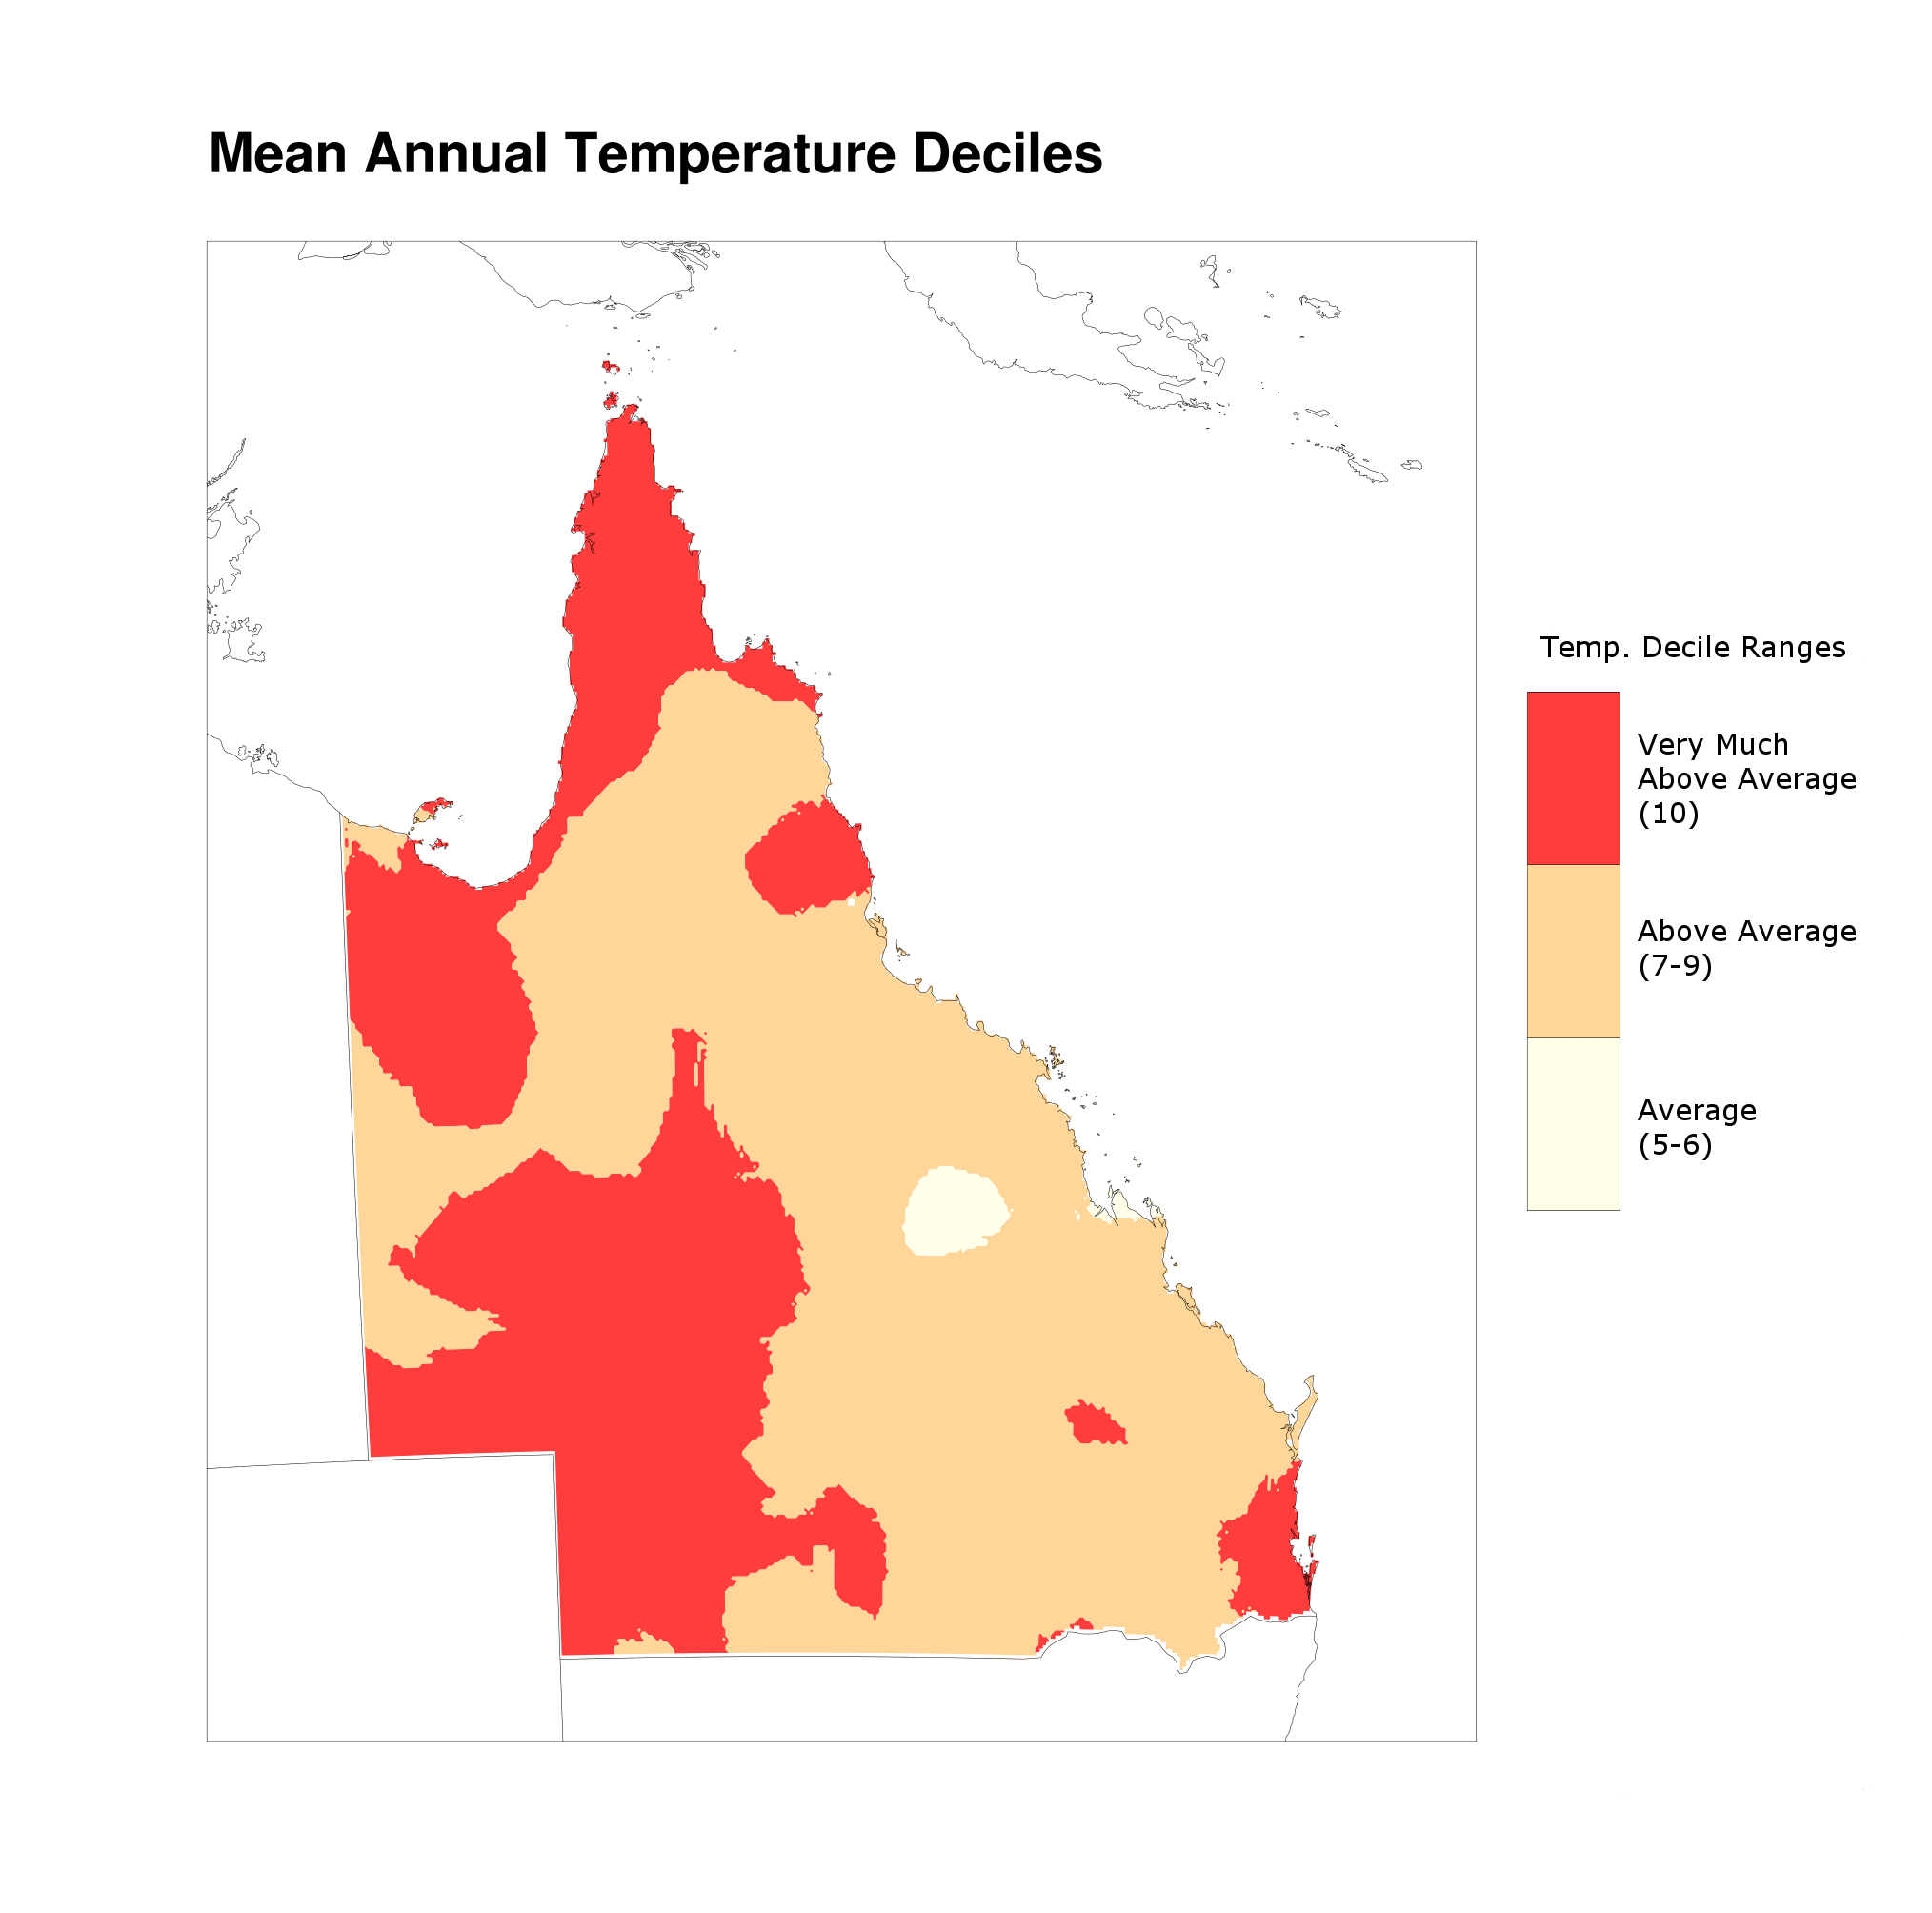
 Decile for mean annual temperature, 2012–2016. Source: Bureau of Meteorology Australian Water Availability Project gridded monthly data. Plotted by the Queensland Government Department of Environment and Science. Decile base-period 1910 to 2015.
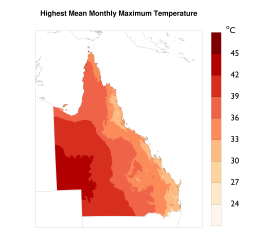 Highest mean daily maximum temperature for any month in the 2012 to 2016 period. Source: Bureau of Meteorology Australian Water Availability Project gridded monthly data. Plotted by the Queensland Government Department of Environment and Science.
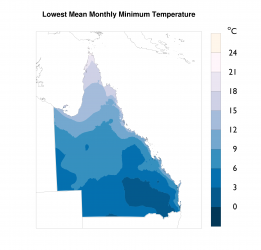 Lowest mean daily minimum temperature for any month in the 2012 to 2016 period. Source: Bureau of Meteorology Australian Water Availability Project gridded monthly data. Plotted by the Queensland Government Department of Environment and Science.
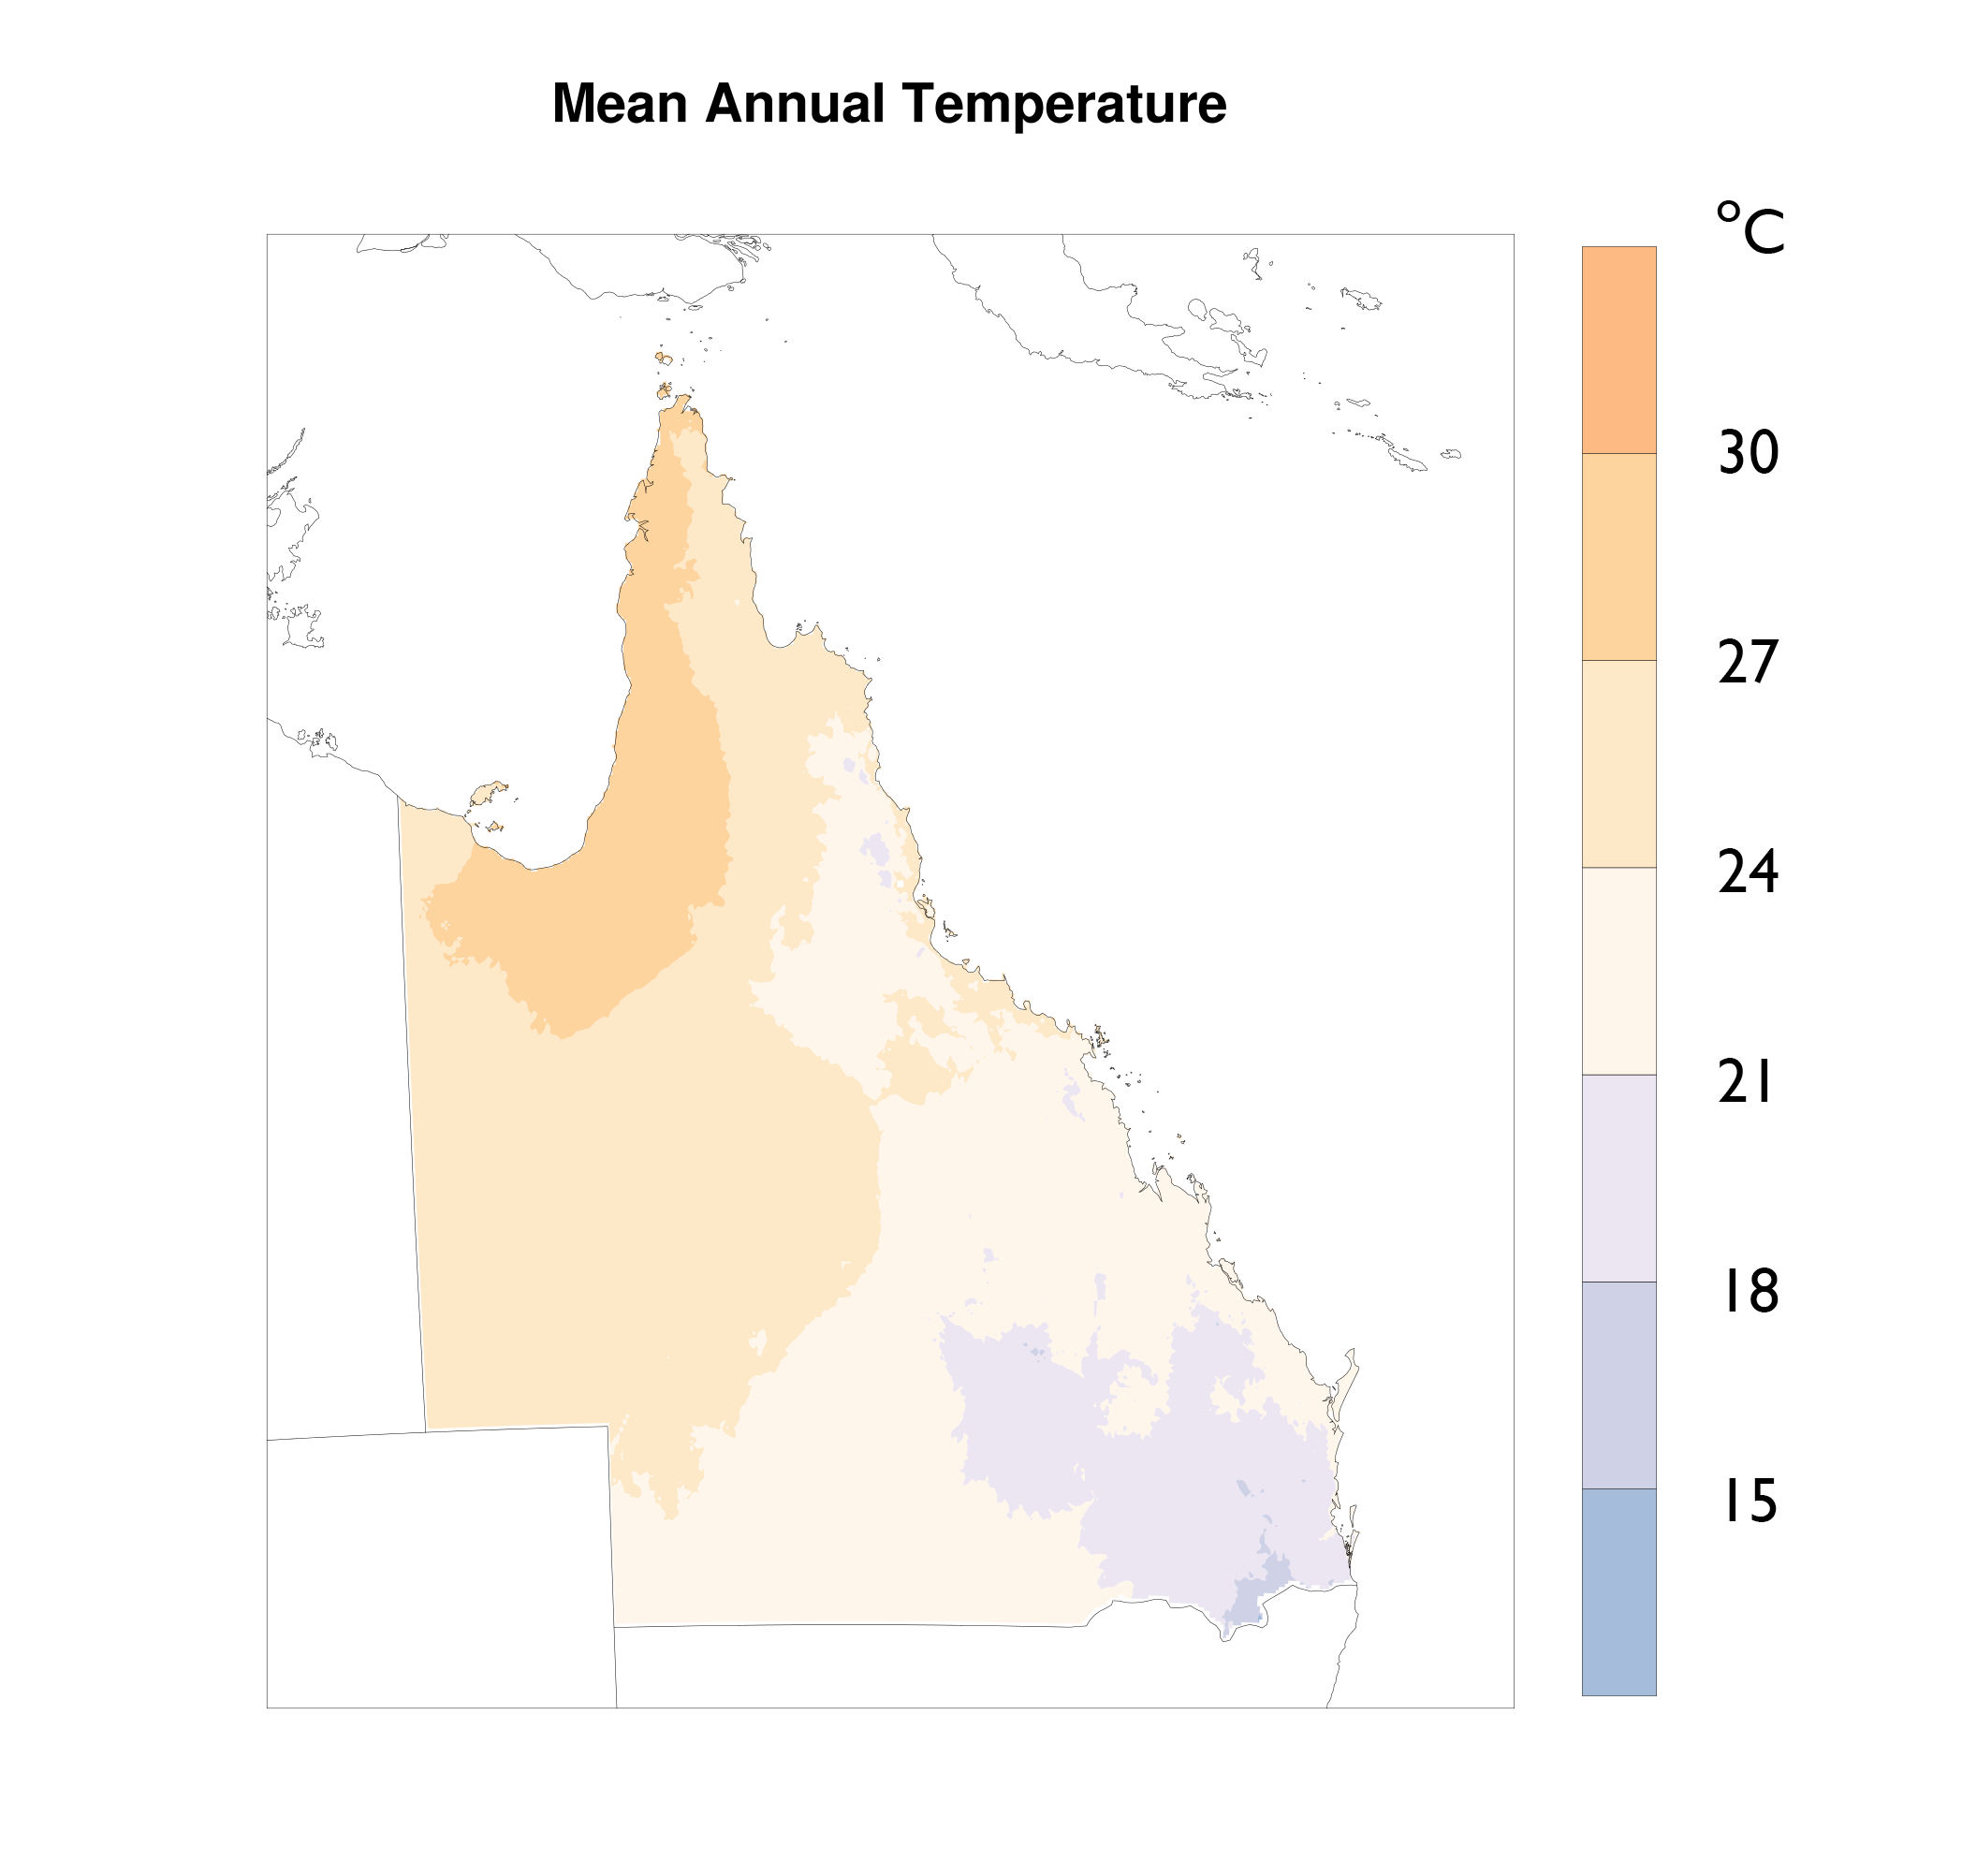
 Mean annual temperature, 2012–2016. Source: Bureau of Meteorology Australian Water Availability Project gridded monthly data. Plotted by the Queensland Government Department of Environment and Science.