Minimum, mean and maximum temperatures
You are viewing the archived 2015 report.
Key finding
Extremely warm temperatures have been experienced across Queensland from 2013 to 2015, including the second, third and fourth warmest years on record.
Filter this information
Queensland or temperature weather stations:
Temperature weather stations (select locations to filter information)
Queensland
The statewide average annual temperature in 2012 (23.1°C) was close to the 1961 to 1990 average of 23.2°C. However, the following three years were extremely warm and included the second, third and fourth warmest years on record.
The warmest year on record was 2005 with a temperature anomaly of 1.3°C above the 1961 to 1990 average.
Annual average temperature across Queensland as a whole has increased by about 1.1°C since 1910. Most of this warming has occurred over the past 50 to 60 years.
Taking 1960 as a reference date, there has been a 1.0°C rise in annual average temperature across Queensland, with mean daily maximum temperatures having warmed by about 0.8°C (compared to 0.9°C since 1910) and mean daily minimum temperatures having warmed by about 1.1°C (compared to 1.4°C since 1910).
The strongest warming since 1960 has been observed across the southern half of the state.
Birdsville Airport
The 1955-2010 annual mean temperature is 23.3°C.
In 2012, the mean temperature at Birdsville Airport of 23.9°C was 0.6°C above average. In 2013 the mean temperature of 24.9°C was also above average, as were mean temperatures for 2014 (24.7°C) and 2015 (24.3°C).
2013 was the warmest year since records commenced in 1955.
Boulia
The 1910-2010 annual mean temperature is 24.4°C.
In 2012, the mean temperature at Boulia of 24.9°C was 0.5°C above average. The mean temperature for 2014 (25.6°C) was also warmer than average.
There are no 2013 and 2015 mean temperature data for Boulia.
Cairns Airport
The 1910-2010 annual mean temperature is 24.5°C.
In 2012, the mean temperature at Cairns Airport of 25.0°C was 0.5°C above average. Mean temperatures for 2013 (25.4°C), 2014 (25.1°C) and 2015 (25.3°C) were also warmer than average.
Over the long term, annual mean temperatures have warmed by about 0.2°C per decade since 1960 (compared to 0.1°C per decade since 1910).
Charleville Airport
The 1910-2010 annual mean temperature is 20.6°C.
In 2012, the mean temperature at Charleville Airport of 20.4°C was 0.2°C below average. In 2013 the mean temperature of 22.2°C was above average, as were mean temperatures for 2014 (22.3°C) and 2015 (22.1°C).
2014 was the second warmest year since records commenced in 1910.
Gayndah Airport
The 1910-2010 annual mean temperature is 20.8°C.
In 2012, the mean temperature at Gayndah Airport of 20.9°C was close to average. In 2013 the mean temperature of 21.8°C was above average, as were mean temperatures for 2014 (22.2°C) and 2015 (21.4°C).
2014 was the warmest year since records commenced in 1910.
Over the long term, annual mean temperatures have warmed by approximately 0.2°C per decade since 1960 (compared to 0.1°C per decade since 1910).
Longreach Airport
The 1910-2010 annual mean temperature is 23.5°C.
In 2012, the mean temperature at Longreach of 22.9°C was 0.6°C below average.
In 2013 the mean temperature of 24.7°C was above average, as were mean temperatures for 2014 (25.0°C) and 2015 (25.0°C).
2014 and 2015 were the second warmest years since records commenced in 1910.
Mackay
The 1910-2010 annual mean temperature is 22.3°C.
In 2012, the mean temperature at Mackay of 22.6°C was 0.3°C above average. In 2013 the mean temperature of 23.4°C was also above average, as were mean temperatures for 2014 (23.1°C) and 2015 (23.5°C).
2015 was the second warmest year since records commenced in 1910.
Over the long term, annual mean temperatures have warmed at approximately 0.2°C per decade since 1960 (compared to 0.1°C per decade since 1910).
Indicator: Minimum, mean and maximum temperatures
Mean, minimum and maximum annual air temperatures for high quality data statewide weather stations using Bureau of Meteorology (BoM) Australian Climate Observations Reference Network (ACORN) with 10yr moving averages. Statewide mean and temperature anomaly using BoM Australian Water Availability Project (AWAP) data. A temperature anomaly indicates the amount of temperature variance, negative or positive, from the mean temperature within a set 30-year time period (1960-1990). Data current as at December 2015.
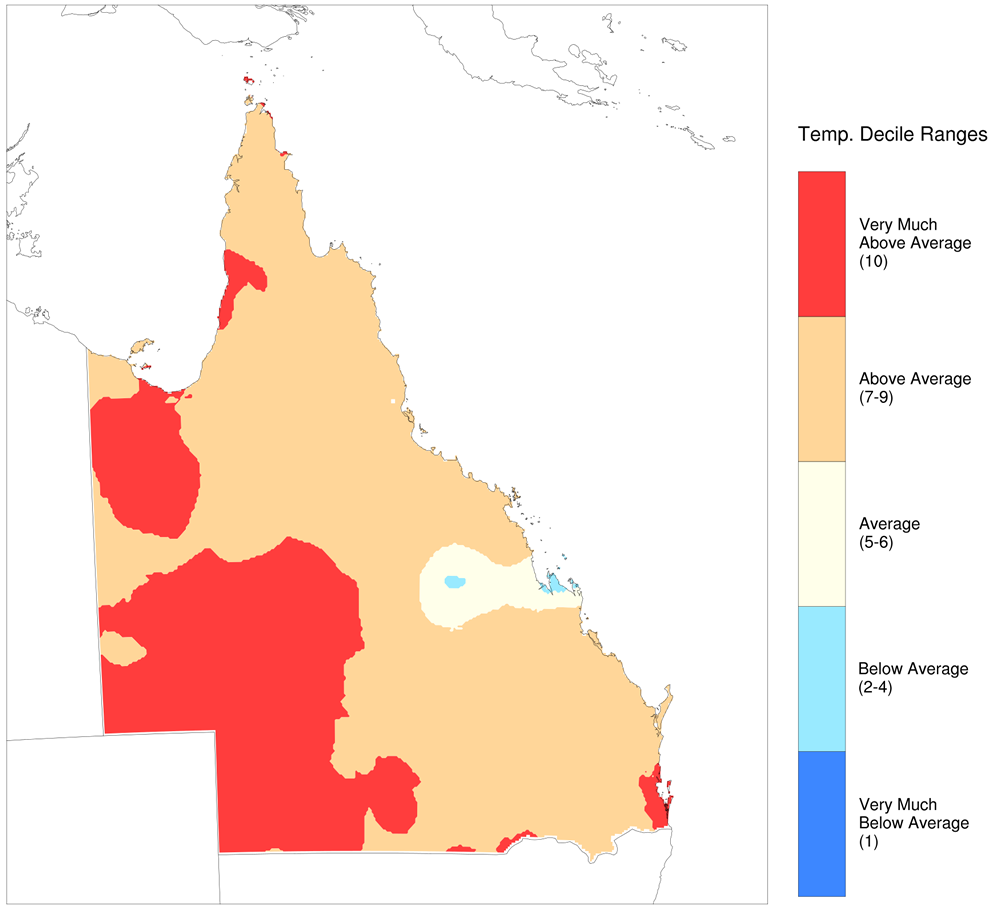
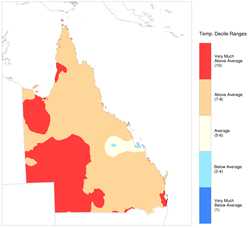 Decile for annual average temperature, 2012-2015. Source: Bureau of Meteorology Australian Water Availability Project gridded monthly data.
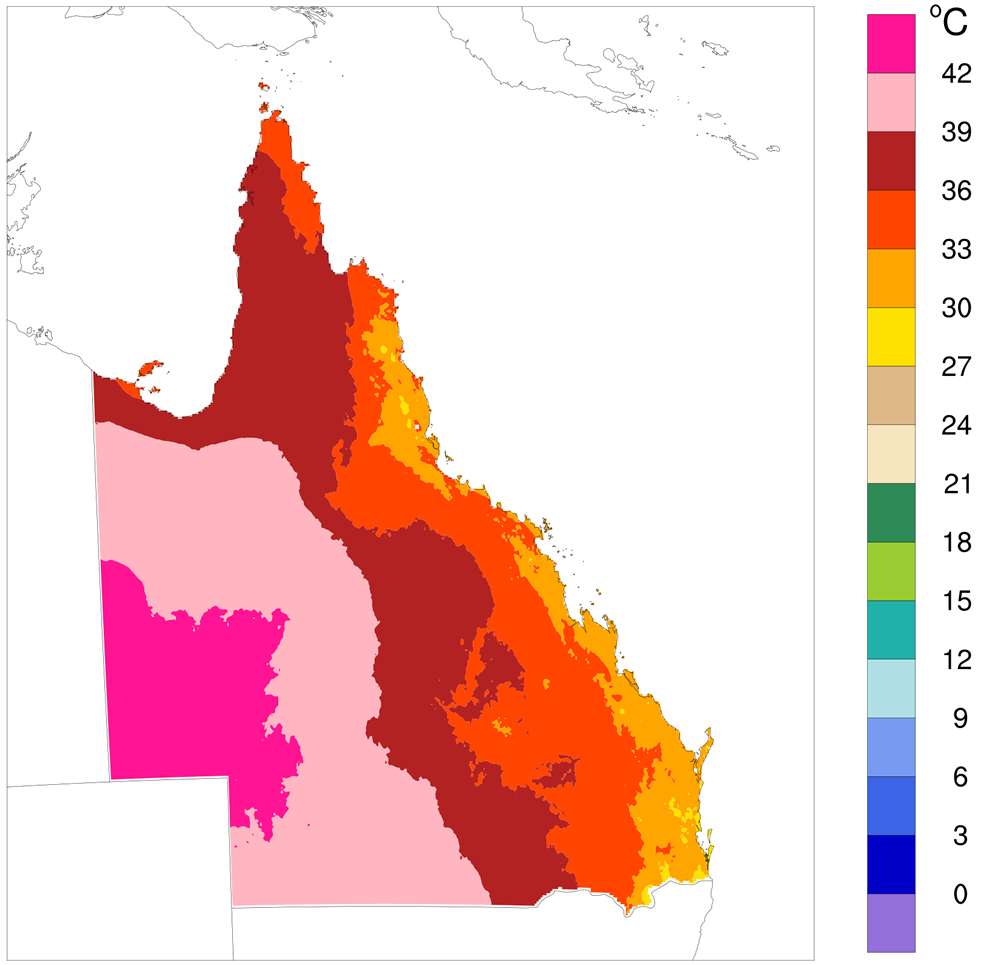
 Highest maximum monthly air temperature, 2012-2015. Source: Bureau of Meteorology Australian Water Availability Project gridded monthly data.
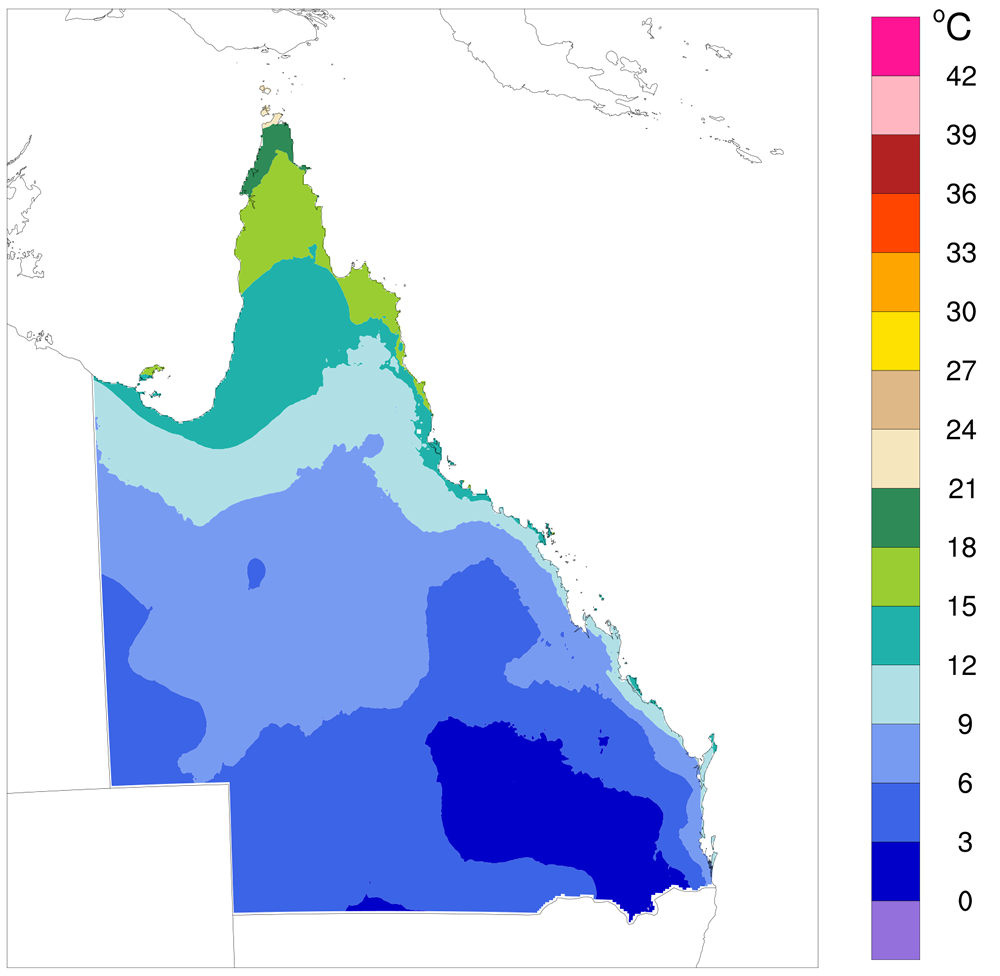
 Lowest minimum monthly air temperature, 2012-2015. Source: Bureau of Meteorology Australian Water Availability Project gridded monthly data.
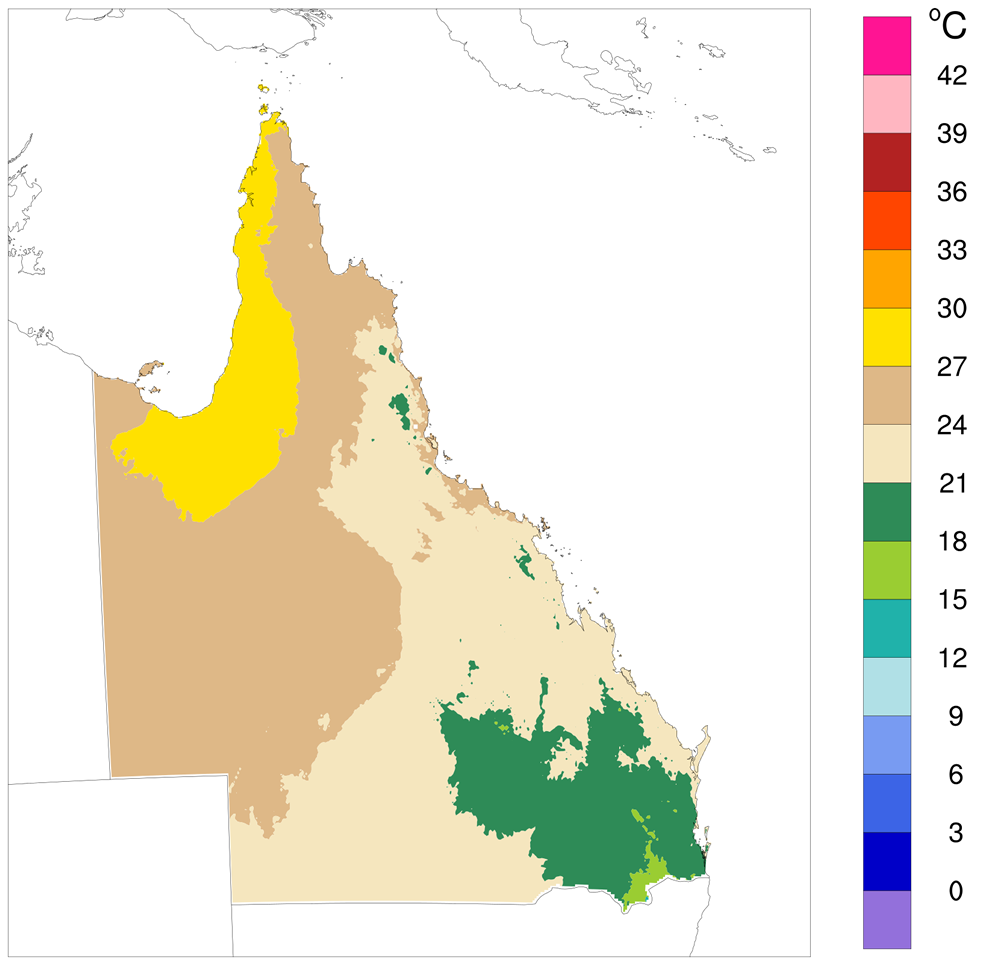
 Annual average air temperature, 2012-2015. Source: Bureau of Meteorology Australian Water Availability Project gridded monthly data.